Publications
September 20, 2012
UPDATE: This brief has been updated to include revised versions of Figure 1 (page 2) and Appendix 1 (page 6). The original version of this brief overestimated the statistical significance of some state-level changes in child poverty between 2010 and 2011, and has been revised accordingly.
January 15, 2013
This brief uses data from the American Community Survey to examine rates of Supplemental Nutrition Assistance Program (SNAP) receipt in 2011, with particular attention to changes since the onset of the recession, and to receipt by family composition, region, and place type (rural, suburban, and central city locations).
April 18, 2017
In 2015, for the second year in a row, child poverty rates declined in the United States. However, familiar patterns in levels and characteristics of child poverty persist: more than one in five children are poor; children of color are at disproportionate risk for poverty; and rates are highest in the South and West and in rural areas and cities (Table 1). This brief uses data from the American…
May 23, 2017
Policy makers and advocates nationwide recognize that funding for early childhood education is a crucial investment in the future. Critical foundational development occurs before age 5, and research consistently shows that high-quality early education for children leads to higher future educational attainment and lower likelihood of crime,1 and yields a return on investment of 7 to 13 percent.2…
July 14, 2015
The Healthy, Hunger-Free Kids Act of 2010, which authorizes funding for federal nutrition programs (including the National School Lunch Program; the School Breakfast Program; the Special Supplemental Nutrition Program for Women, Infants, and Children; the Summer Food Service Program; and the Child and Adult Care Food Program), is set to expire on September 30, 2015.1 The reauthorization process…
July 28, 2015
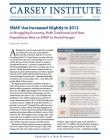
From the beginning of the Great Recession in 2007 until 2012, receipt of Supplemental Nutrition Assistance Program (SNAP) benefits grew steadily.1 Participation and funding rose to historic levels2 driven by the changing economy, intensified efforts to enroll eligible populations, and expanded benefits and eligibility via the 2009 American Recovery and Reinvestment Act. Throughout the recovery,…
September 18, 2015
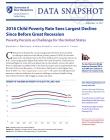
Poverty data from the American Community Survey were released on September 17, 2015, allowing a detailed examination of poverty in 2014 across the United States. These data reveal that child poverty has fallen slightly in the last year yet the longer term pattern of high child poverty persists. The levels of child poverty vary enormously along racial and ethnic lines though all groups have seen a…
December 16, 2015
In September 2015, the Census Bureau released 2014 poverty data from the American Community Survey (ACS), the only regular source for reliably estimating child poverty in geographic areas below the state level using the official poverty measure. In this brief, we use ACS data to explore child poverty rates across the United States by region, state, and place type (rural, suburban, and city). We…
September 13, 2018
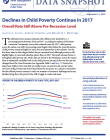
The official poverty measure indicates that child poverty declined by 1.1 percentage points between 2016 and 2017, according to analyses of the latest American Community Survey data released today. By 2017, child poverty across the nation was still 0.4 percentage point higher than before the Great Recession. Child poverty remained higher in cities and rural places than in the suburbs. For the…
June 18, 2013
This brief describes the population who would be directly affected by the President’s proposal to increase the minimum wage to $9.00 per hour: workers earning between $7.25 and $9.00 per hour.
September 20, 2013
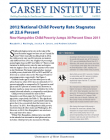
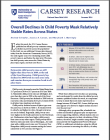
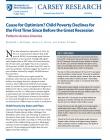
In this brief, authors Marybeth Mattingly, Jessica Carson, and Andrew Schaefer use American Community Survey data released on September 19, 2012, to explore patterns of child poverty across states and place types, focusing on changes both since 2011 and since the recession began in 2007.
November 5, 2013
This brief uses data from the American Community Survey to examine rates of Supplemental Nutrition Assistance Program (SNAP) receipt in 2012, track changes since the onset of the recession, and monitor receipt by region and place type.
June 15, 2016
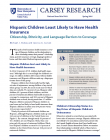
This policy brief examines health insurance coverage of Hispanic children and its relationship to their citizenship status, their parents’1 citizenship status, parents’ insurance coverage, language spoken at home, and their state’s Medicaid expansion policies.
Hispanic Children Are Least Likely to Have Health Insurance
In 2014, 94 percent of U.S. children had health insurance.2 Although this…
September 15, 2016
Earlier this week, the U.S. Census Bureau published its official poverty estimates noting a decline in poverty across the population.1 In this brief, we use additional Census data released today from the American Community Survey (ACS), the only regular source for estimating yearly child poverty rates at, and below, the state level. We examine child poverty rates across the United States by place…
June 3, 2014
This brief uses data from the 2013 Annual Social and Economic Supplement to the Current Population Survey to examine how President Obama’s proposed expanded eligibility and higher credit values might affect tax filers in both rural and urban America.
July 6, 2017
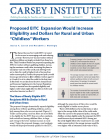
The Affordable Care Act in 2010 gave states the option to expand Medicaid access to adults with incomes up to 138 percent of the federal poverty level. Thus more able-bodied and working adults have become eligible for Medicaid. In addition, several states have petitioned the federal government to have the option to enforce work requirements for those receiving Medicaid in their state.1 Specific…
September 19, 2014
New data released on September 18, 2014, by the U.S. Census Bureau indicate that child poverty fell by 0.4 percentage point between 2012 and 2013, to 22.2 percent. Though still significantly higher than in 2007 when the Great Recession hit (18.0 percent), and higher than at its conclusion (20.0 percent) in 2009, the decline from 2012 may be cause for optimism. Estimates suggest the number of poor…
October 21, 2014
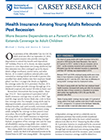
While much of the existing research explores young adults' insurance only in the post-recession period (that is, 2010 to present), authors Michael Staley and Jessica Carson assess young adults' rates of coverage within and beyond the context of the recession by examining changes across the entire 2007 to 2012 period.
July 25, 2017
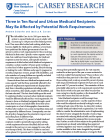
Founded in 1965, Head Start is designed to promote “school readiness of children under 5 from low-income families through education, health, social, and other services.”1 Created in 1994, Early Head Start focuses specifically on the youngest children—those under age 3, and pregnant women—and provides “early, continuous, intensive, and comprehensive child development and family support services to…
September 14, 2017
Child poverty declined by 1.2 percentage points between 2015 and 2016, according to analyses of the official poverty measure (OPM) in the latest American Community Survey. By 2016, child poverty across the nation was still 1.5 percentage points higher than before the Great Recession.