download the brief
Key Findings
Births between 2020 and 2024 are at a 40-year low, according to recently released Census data.
Deaths in the past four years have been at record highs.
As a result, deaths exceeded births in nearly 72 percent of all U.S. counties between 2020 and 2024.
Only 3,606,000 babies were born in the United States between July 2023 and July 2024, 43,000 fewer than the year before and barely exceeding (by 22,000) the 43-year low in 2020–2021, according to new Census Bureau estimates. Births are diminishing because fertility rates are at record lows, continuing a long-term decline that accelerated during the Great Recession. There were 16 percent fewer births last year than just before the Great Recession, even though there were 8 percent more women in their prime childbearing years (aged 20–39).
In contrast, deaths and mortality rates diminished modestly last year from Covid-era highs, though deaths remain nearly 10 percent above pre-pandemic levels. As a result, the balance between births and deaths remains in flux. Last year, births exceeded deaths by 517,000, considerably more than the natural gain of just 146,000 during the depths of the pandemic. Yet, last year’s natural gain was just 43 percent of the average gain —1.2 million—in the five years prior to the pandemic. A substantial excess of births over deaths has long been the primary driver of U.S. population growth, but as this surplus dwindled in the last four years, immigration provided the bulk of the nation’s population increase.
The Continuing Local Impact of Fewer Births and More Deaths
These national trends are important, but one stark statistic illustrates the impact of diminishing fertility and higher mortality on local communities: more people died than were born in 2,088 (68 percent) of the nation’s 3,144 counties between July 2023 and July 2024, continuing a pandemic era trend. In the four years since the pandemic began in early 2020, more people have died than been born in 72 percent of the nation’s counties, the most to ever suffer such a loss and 60 percent more than in the years just before the Covid pandemic. When births fail to keep pace with deaths in a county, there is a “natural decrease” in population.
Natural decrease has been occurring in some areas for decades, but more than 500 counties experienced it for the first time since the pandemic began. Nearly 62 percent of all counties had more deaths than births in each of the past four years (Figure 1). An additional 13 percent experienced natural decrease in two or three of the last four years. Only 19 percent of the 3,144 U.S. counties had more births than deaths in each of the past four years. These recent levels of natural decrease are unprecedented. Between 2010 and 2019, only 43 percent of the counties had overall natural decrease and just 20 percent had it each year.
Natural decrease is geographically widespread. More than 70 percent of the counties in the Northeast, Midwest, and South had overall natural decrease between 2020 and 2024 (Figure 2). Even in the West, 55 percent of the counties had more deaths than births. There were exceptions to this overall trend including in large metropolitan areas, counties with large immigrant populations, and areas where religious groups encouraging large families are concentrated.
Figure 1. Number of Years Deaths Exceeded Births in a County, July 2020 to July 2024
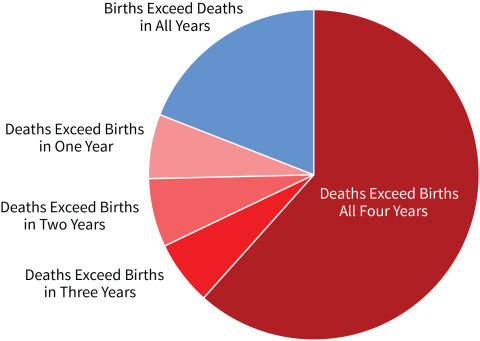
Source: U.S. Census Bureau Estimates.
Analysis: K.M. Johnson, UNH Carsey School.
Figure 2. Number of Years Deaths Exceeded Births in a County, July 2020 to July 2024
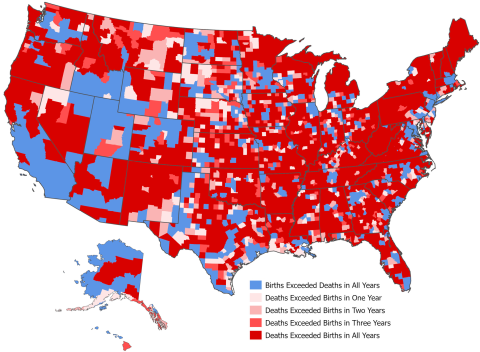
Source: U.S. Census Bureau Estimates. Analysis: K.M. Johnson, UNH Carsey School.
Covid deaths contributed to the recent rise in natural decrease, but many of the driving factors predate the pandemic. Natural decrease occurs more often in counties with older populations, fewer women of childbearing age, and lower fertility rates. Covid exacerbated natural decrease in these places by increasing mortality among older populations, many of whom had preexisting conditions and limited access to health care, especially in rural areas. Natural decrease is much more common in rural areas and is now occurring in 82 percent of nonmetropolitan counties compared to 54 percent before the pandemic. However, metropolitan counties have not been immune, as 55 percent experienced natural decrease in this period, up from 31 percent in prior period.
Future Demographic Trends
Given natural increase’s substantial contribution to the nation’s past population gains, it is important to consider its future role. Currently, how large a contribution natural increase will make to future population change is very much in doubt. Prior to the pandemic, mortality was already increasing due to the aging of the population, while fertility was diminishing. So, the excess of births over deaths was already dwindling. Covid exacerbated this by significantly increasing mortality. As the impact of Covid waned, the number of deaths diminished modestly in the past two years. Yet there has been no uptick in births. The magnitude of future natural gains depends largely on the number of future births because deaths will continue to rise as the population ages.
There was some expectation that fertility might rise after the economic and social turbulence of the Recession as well as Covid receded, but birth rates have continued to decline, and the number of childless women continues to rise. This suggests that generational attitudes about fertility, marriage, and children are being influenced by changing social, demographic, economic, and cultural factors including greater educational and employment opportunities for women, inflation, the growing expense of children, limited access to childcare and family leave, cohabitation, and immigration. Future fertility trends have important implications for health care, schools, child-related businesses, and eventually for the labor force and Social Security. Whether fertility will continue to fall is certainly an open question and one with significant implications for the nation’s future.
Methods and Data
This analysis is based on Census Bureau Population Estimates for April 1, 2020, to June 30, 2024, released on March 13, 2025. Readers should recognize that although the Bureau uses the best data and algorithms available at the time of release to generate the data, they remain estimates and are subject to future revision.
About the Author
Kenneth M. Johnson is senior demographer at the Carsey School of Public Policy, professor of sociology at the University of New Hampshire, and an Andrew Carnegie Fellow. His research was supported by the NH Agricultural Experiment Station through joint funding from the USDA National Institute of Food and Agriculture (under Hatch-Multistate project W5001, award number 7003437) and the state of New Hampshire. The opinions are his and not those of the sponsoring organizations. Barb Cook of the Carsey School provided GIS support on this project.
© 2025. University of New Hampshire. All rights reserved.