download the data snapshot
Key Findings
There were only 3,591,000 births in the United States in 2023, according to new data from National Center for Health Statistics. This is the fewest U.S. births since 1979, when the U.S. population was 225.1 million compared to 340 million in 2023. The 2023 decline in births continues a trend that began in the Great Recession. In 2023, there were 725,0000 fewer births than in 2007—a 16.8 percent decrease—even though the number of women in their prime childbearing years (aged 20–39) rose by 8.4 percent. Births diminished because fertility rates declined significantly among women in their teens and twenties. Fertility rate declines were substantial for these younger women regardless of race and ethnicity. Fertility rates changes were smaller among women over 30, diminishing slightly among women in their early thirties and increasing among women 35 to 49. However, fertility gains among older women were too small to offset the significant declines among younger women.
The long-term impact of the fertility decline has been substantial. Had 2007 fertility patterns been sustained through 2023, there would have been 10.6 million more births in the last 16 years (Figure 1). Factors including diminished immigration, later marriage and childbearing, greater educational and employment opportunities for women, and limited access to childcare and family leave likely contributed to the fertility declines.
A critical long-term question is: how many of these births are being delayed, and how many will be foregone? Although early expectations were that many of these births were only delayed, lower marriage rates and a rise in the proportion of childless women suggests that a significant number of these births will be foregone entirely. This has implications for health care, schools, child-related businesses, and eventually for the labor force.
Figure 1. Number of Years that Deaths Exceed Births in States, 2020 to 2022
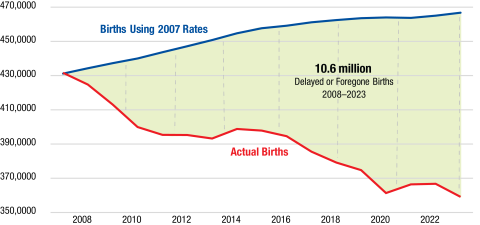
Source: NCHS-CDC and author’s calculations.

Kenneth M. Johnson is senior demographer at the Carsey School of Public Policy, professor of sociology at the University of New Hampshire, and an Andrew Carnegie Fellow. The opinions are his and not those of the sponsoring organizations.