download the brief
Key Findings

Though the rural population is generally easier to count than the urban population, several places and populations in rural areas will be difficult to enumerate accurately in the 2020 Census. They include: Blacks in the rural South, Hispanics in the rural Southwest, American Indians living on reservations and Alaskan Natives, Residents of deep Appalachia and Migrant and seasonal farmworkers.
The 2020 Census will have ramifications for every person in the United States, urban and rural residents alike.1 Interest in the Census is growing2 and the Census Bureau’s plans are becoming more concrete,3 but little has been written about the special challenges that will make some rural areas and populations difficult to enumerate accurately.
This brief identifies rural areas where special outreach and operations will be needed to get a complete and accurate count. It also addresses key Census-related issues that will be important for rural leaders to monitor between now and April 1, 2020.
Hard-to-Count Places and Populations in Rural America
The Census is intended to be a complete count of everyone in the country, but people are always missed, that is, undercounted, and people in some places and groups are more likely to be missed than others. Groups most likely to be missed are called hard-to-count (HTC) populations, and places most likely to be missed are called hard-to-count areas.
Hard-to-Count Characteristics in Urban and Rural Areas
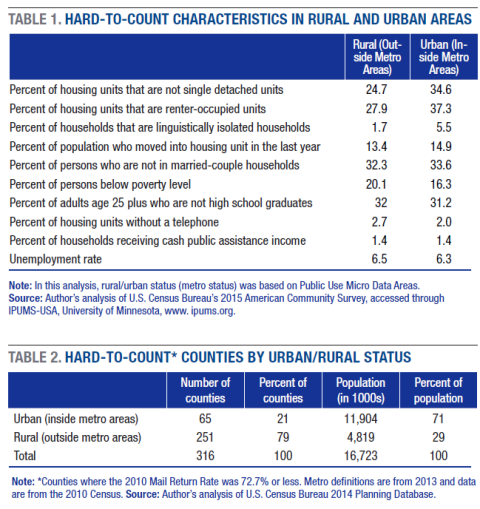
The Census Bureau has identified twelve characteristics associated with low mail response rates and census undercounts.4 Ten of these are shown in Table 1, along with percentages for urban and rural areas based on the Census Bureau’s 2015 American Community Survey.5 A higher value in Table 1 indicates that the population is more difficult to count.
Values for five of the HTC characteristics indicate that the population in rural areas should be easier to count than the urban population:
-
The share of single detached homes is higher in rural areas.
-
The share of renters is smaller in rural areas.
-
Fewer households in rural areas are linguistically isolated (linguistically isolated refers to households where no one over age 14 speaks English well).
-
The share of people living in married-couple households is higher in rural areas.
-
The percent of people who have not moved in the last year is higher in rural areas.
One characteristic suggests that rural areas will be more difficult to count accurately:
- Poverty rates are higher in rural areas.
- Rural and urban areas are about the same in terms of:
- The percent of the population without a telephone
- The percent of people receiving cash public assistance
- The unemployment rate
- Adults who are not high school graduates
The data in Table 1 provide good background information for assessing how the 2020 Census will unfold in urban and rural areas.
Hard-to-Count Areas and Populations in Rural America
The Census Bureau does not produce undercount rates for rural areas, but its calculation of 2010 Census mail return rates for counties can serve as a proxy for Census accuracy 7 Places with low mail return rates are usually counted less accurately.
The Census Bureau defines the mail return rates as “[t]he number of mail returns received out of the total number of valid occupied housing units (HUs) in the Mailout/Mailback universe which excludes deleted, vacant, or units identified as undeliverable as addressed.” 8 Of the 3,112 counties that had a mail return rate calculated by the Census Bureau in 2010, the 10 percent with the lowest mail return rates (returns of less than 72.7 percent) are considered HTC counties in this analysis. This threshold is consistent with the county-level threshold used in a 2010 study by the author. 9 Using this criterion yields a total of 316 HTC counties.
Examining the HTC counties from two different perspectives provides contrasting views of how the 2020 Census will unfold in rural America. Table 2 shows the distribution of the population and counties for the HTC county dataset. The majority of the population living in HTC counties (71 percent) are in urban areas, but the majority of HTC counties (79 percent) are in rural areas.
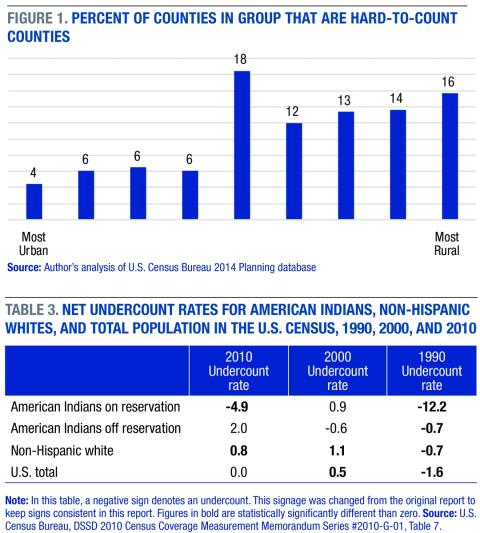
The metro and nonmetro categories used in Table 2 are relatively gross or aggregated categories— a county is either urban or rural. Figure 1 shows the distribution of HTC counties along the U.S. Department of Agriculture’s (USDA) rural-urban continuum, which separates counties into nine categories from most urban to most rural. The figure illustrates that the more rural a county is, the higher the likelihood that it is among the hard-to-count. Only 4 percent of the most urban counties fall in the HTC category, compared to 16 percent of the most rural counties.
This pattern is not new. Based on data from the 2000 Census, 99 of the 126 U.S. counties where more than half the population lived in HTC areas were located outside of metropolitan areas.10
Racial Overlay to Hard-to-Count Rural Areas
Census studies conducted over the past fifty years have consistently shown that the undercount has been greater among racial and ethnic minorities than among whites. Therefore, it is not surprising that a substantial share of the HTC counties are ones where blacks, Hispanics, or American Indians are more than 50 percent of the population. Many of these majority-minority counties are in rural areas.
Of the 316 HTC counties, forty-three were black-majority counties, thirty-seven were Hispanic-majority counties, twelve were American Indian/Alaska Native-majority counties, and one was an Asian-majority county. Of these ninety-three majority-minority counties, seventy-five were rural. In other words, about a quarter of all the HTC counties in the nation are rural majority-minority counties.
Most of the rural black-majority HTC counties are located in the Deep South. Of the thirty-four black-majority HTC rural counties, there were sixteen in Mississippi, seven in Georgia, five in Alabama, four in Arkansas, and two in Louisiana.
Of the thirty-seven Hispanic-majority HTC counties, twenty-nine were located in rural areas, mostly in the Southwest: twenty in Texas, five in New Mexico, and two each in Colorado and Kansas. Some of the hard-to-count counties are home to “colonias” along the U.S. southern border. According to the U.S. Census Bureau,11 colonias “are generally unincorporated and low income residential subdivisions, lacking basic infrastructure and services along the border between the U.S. and Mexico.”
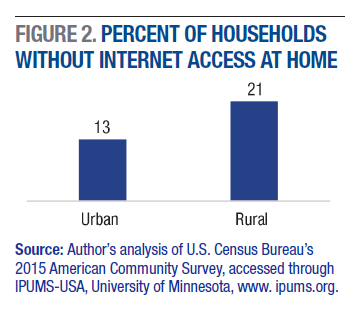
Table 3 shows the net undercount rate in the 1990, 2000, and 2010 Censuses for American Indians living on reservations. Data for American Indians not living on reservations, non-Hispanic whites, and the total U.S. population are provided for comparison. The net undercount rate for American Indians living on reservations was very high in 1990 and 2010, but there was a small overcount in 2000. Part of the unevenness of the undercount estimates for 1990 to 2010 may stem from the sampling error for this relatively small group.
Since many of the conditions that led to high net undercounts on American Indian reservations in the past, such as high poverty, low educational attainment, and high unemployment, still exist, there is no reason to believe this problem will disappear in 2020.
All of the twelve HTC counties where the majority of the population was American Indian or Alaskan Native were rural, with seven in Alaska and one each in Arizona, New Mexico, North Dakota, Oklahoma, and South Dakota.
Hard-to-Count Populations in Appalachia
The Appalachian region contains 420 counties and runs from lower New York State to the northern parts of Georgia, Alabama, and Mississippi. A recent report shows that 34 percent of the population in Appalachia lives in nonmetro counties, twice the national level.12 Historically Appalachia has been one of the poorer regions of the country.
The most remote rural areas of Appalachia, defined here as nonmetropolitan counties that are not adjacent to a metro area, have a higher percentage of their population living in HTC areas than any other type of area in Appalachia.13 In West Virginia, which is entirely in the Appalachian region, nearly one-quarter of the population lives in HTC census tracts, a higher share than any other part of Appalachia and higher than the national average.14
Migrant and Seasonal Farmworkers
One other largely rural population that will be difficult to enumerate in the 2020 Census is migrant and seasonal farmworkers. It has been estimated that there are about 3 million migrant and seasonal farmworkers in the nation,15 with a substantial portion residing in the rural parts of Arizona, California, New Mexico, and Texas.16
There are no data from the Census Bureau on the coverage of migrant farmworkers in the decennial Census. But migrant farmworkers have many of the characteristics that are associated with Census undercounting—high poverty rates, high mobility, nonstandard living quarters, language problems, illiteracy, and distrust of outsiders.17
Several studies have suggested that migrant farmworkers are undercounted in the Census.18 In 2003, the U.S. General Accounting Office (now the Government Accountability Office) concluded:
One of the U.S. Census Bureau’s (Bureau) long-standing challenges has been counting migrant and seasonal farm workers. Although the Bureau takes extra steps to count these individuals, its efforts are hampered by the frequent moves, temporary and unconventional housing arrangements, overcrowded dwellings, and language barriers that often accompany this population.19
There is little to lead us to expect that the housing conditions and living arrangements of migrant farmworkers will improve in time for the 2020 Census in ways that will improve the count of this population. In fact, recent increases in suspicion and fear of the federal government in some populations is already decreasing their willingness to respond to Census Bureau surveys.20
Potential Problems With the American Community Survey and Census
With less than two-and-a-half years until the 2020 Census commences, many Census watchers are worried about possible developments that could undermine data quality. It will be important for rural advocates to keep an eye on Washington to ensure rural interests are not compromised. A few of the key issues are described below.
Threats to American Community Survey Funding and Reliability
Starting in 2005, topics that previously appeared on the long-form decennial Census were moved to an ongoing Census Bureau sample survey called the American Community Survey (ACS). Thus, the ACS is part of the decennial Census.
The ACS sample must be combined over five years to provide a large enough size to produce reliable estimates for smaller places, and the small sample size in many geographic areas makes the ACS different for rural areas than for urban areas.
There are two main threats to the ACS, and both would have important consequences for rural areas. The first threat relates to funding. Census Bureau funding has been unusually unreliable in the past few years,21 and Congress could potentially cut money from the ACS directly or cut 2020 decennial Census funding to the point where the Census Bureau needs to take money away from ACS to conduct the decennial Census. If this happens, one likely scenario would be a reduction in ACS sample size, a move that would impact rural areas disproportionately.
A second threat to the ACS has to do with the mandatory nature of the survey. Since the ACS is part of the decennial Census, respondents are required by law to participate. If Congress requires the Census Bureau to make the ACS voluntary rather than mandatory, response rates could fall, and the impact of the reduced effective sample size would hit rural areas the hardest.
If the ACS sample size is reduced for either of these reasons, the Census Bureau could not produce reliable estimates for many small counties, small towns, and villages across the nation. Such was the outcome in Canada, when it made its ACS-like survey voluntary in 2011.22 One study shows that if the ACS were to become a voluntary survey, most of the counties that would be hit the hardest in terms of loss of data quality are in rural America.23 With respect to reducing ACS sample size, the U.S. Census Bureau concludes: “This would disproportionately affect the accuracy of the results that we produce for many small areas and small population groups throughout the nation."24
Concerns About Use of the Internet for the 2020 Census
Counting every person in the nation—once, just once, and in the right location—is a huge and complex task, and the Census Bureau has already documented many of the challenges facing the 2020 Census.25 Some have suggested that the 2020 Census may be the most difficult in our country’s history.26As we move into fiscal year 2018, funding for the Census Bureau appears to be a major problem. The bureau had planned to ramp up preparations for the 2020 Census in fiscal year 2018, but it has had to curtail many of its tests because of budget shortfalls or budget uncertainty.
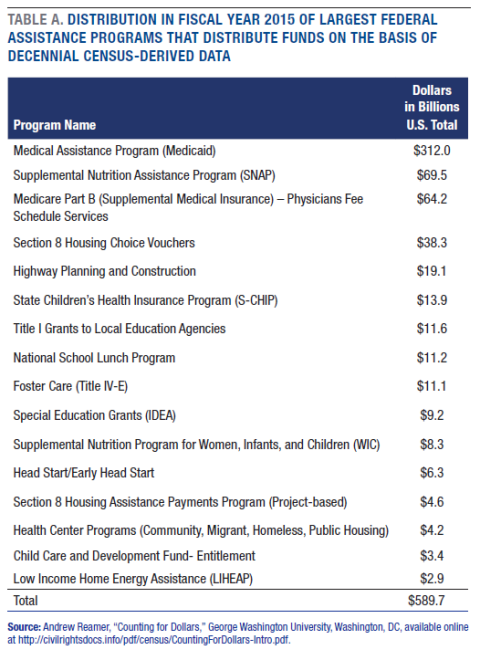
Current Census plans call for about 80 percent of the country to receive communications that will urge a response via the internet, and about 20 percent of the population, mostly in rural areas, will be offered a choice of internet response or a paper questionnaire.
Yet heavy reliance on the internet in the 2020 Census has important implications for rural areas because there are lower internet access and use rates in rural areas. As illustrated in Figure 2, 21 percent of rural residents do not have internet service at home compared to only 13 percent of urban residents, based on the 2015 ACS. Even when rural residents have internet available, it is often slower.27 One report summarized this issue by noting: “the problem with pushing online self-response is that many rural areas lack broadband or any internet service, and those people may be undercounted.”28
Concerns about the lower internet penetration rate in rural America are compounded by budget issues. The Census Bureau had planned to conduct an “end-to-end” test in April 2018 at three sites—rural West Virginia, suburban Tacoma, WA, and Providence, RI—but for budget reasons the tests in rural West Virginia along with Tacoma, WA were cancelled. The end-to-end test is critical because it is the only time the Census Bureau will be able to test all of the operations, procedures, systems, and field infrastructure to ensure proper integration. The cancellation of the West Virginia portion of this test is crucial because a test conducted in an area with weak internet access like the rural West Virginia site could reveal problems with internet data collection plans for the 2020 Census that might be more prevalent in rural areas. Recent congressional testimony from the U.S. Government Accountability Office suggests that weak internet access at the West Virginia site may compromise some components of the 2020 Census.29
Many vulnerable groups in rural America have very low rates of internet access at home. According to the 2015 ACS, about 40 percent of impoverished blacks in the rural South and impoverished Hispanics in the rural Southwest do not have internet access at home. Among American Indians/Alaska Natives, “Some tribes reported that internet response is currently not a viable option for members.…”30
To be clear, the Census methods proposed for 2020 call for sending out paper questionnaires in areas where there is little or no high-speed internet available, and households that do not respond by internet or mail will be visited by a Census enumerator. But the paper mode of data collection will not be emphasized like the internet response will be, and Census Bureau research shows that the self-response rates for some groups decrease when an internet mode of response is added.31 It is difficult to assess what the emphasis on internet response will mean for rural areas in terms of overall response rates, but it is an area of concern.
Conclusion
The 2020 Census is a little more than two years away, and careful planning and adequate budgeting are needed now. The consequences of poor planning or inadequate funding will be serious, and there are potential problems that may affect rural areas more than urban areas.
Generally, rural residents are less likely than urban residents to live in areas that will be the most difficult to enumerate in the 2020 Census, but some groups and some places in rural America will nevertheless be very difficult to enumerate accurately. Special attention is needed for populations and places, such as:
-
Blacks in the rural South
-
Hispanics in the rural Southwest
-
American Indians on reservations
-
Alaska Natives
-
Residents of deep Appalachia
-
Migrant and seasonal farmworkers
The heavy reliance on the internet in the 2020 Census may pose a special concern for rural residents. Data show that good internet access is less likely to be available in rural areas, and a test that might reveal difficulties with the 2020 Census in rural areas has recently been cancelled.
It is important that rural scholars, rural leaders, and rural advocates monitor Census Bureau funding and Census planning over the next two years to make sure there are adequate resources for a complete and accurate count of all rural residents in the next U.S. decennial Census.
Box 1: Why the Census Is Important
Because Census data have countless applications in political, business, and social welfare arenas, Census accuracy is critical. Examples of the important uses of Census data include:
-
Allocation of political power through reapportionment of seats in Congress and drawing of new legislative districts
-
Distribution of federal funds through funding formulas
-
Civil rights enforcement through fair housing laws, the Voting Rights Act, and other legislation
-
Business site selection when companies are deciding where to expand
-
Population estimates and projections derived from Census counts
-
Weights for sample surveys
-
Denominators for rates
-
Community planning for schools and hospitals
-
Economic and social science research
Recent research finds that Census-derived data are used to distribute more than $600 billion a year to states and localities,6 or more than $6 trillion over the ten-year period of the Census cycle. Table A shows data for the 16 largest federal programs that use Census-derived data to distribute funds. State-by-state data are available at http://civilrights.org/census.
Undercounted communities do not receive their fair share of public funds for things like schools, hospitals, day care centers, and roads. Rural communities that are already struggling economically can ill afford to lose federal money because they are not fully counted in the Census.
Endnotes
1. In this brief, rural refers to people and places outside of the Census Bureau’s metropolitan statistical areas (MSAs), and urban refers to people and places inside MSAs. The terms urban and metro are used interchangeably in this report as are rural and nonmetro.
2. H. Long, “Republicans Could Lose Congressional Seats if Census 2020 Goes Wrong,” Washington Post Wonkblog, October 12, 2017; M. Scherer and T. Bahrampour, “2020 Census Needs Major Cash Infusion, Commerce Secretary Will Tell Congress Thursday,” Washington Post, October 10 2017; C. Skelding, “With a Congressional Seat in the Balance, City Planning Prepares for Census Count,” Politico, October 2, 2017; E. McCrimmon, “The 2020 Census Is Headed for Trouble,” Congressional Quarterly, September 5, 2017.
3. U.S. Census Bureau, “2020 Census Operational Plan: A New Design for the 21st Century, Version 3.0,” Washington, DC, 2017.
4. A. Bruce and J.G. Robinson, “The Planning Database: Its Development and Use as an Effective Tool in Census 2000,” paper presented at the Annual Meeting of the Southern Demographic Association, Arlington, VA, 2003.
5. Two of the measures could not be computed from the data source used.
6. A.D. Reamer, Counting for Dollars (Washington, DC: George Washington University, 2017).
7. C. Erdman and N. Bates, “The Low Response Score (LRS): A Metric to Locate, Predict, and Manage Hard-to-Survey Populations, Public Opinion Quarterly 81, no. 1 (2017): 144-56; D.I. Word, “Who Responds/Who Doesn’t? Analyzing Variation in Mail Response Rates During the 1990 Census,” Population Division Working Paper No. 19 (Washington, DC: U.S. Census Bureau, 1997); W.P. O’Hare, “Who Lives in Hard-to-Count Neighborhoods?” International Journal of Social Science Studies 4, no. 4 (2016): 43–55.
8. U.S. Census Bureau,” 2014 Planning Data Base,” Washington, DC, 2014, 36.
9. W.P. O’Hare, “Rural Areas Risk Being Overlooked in the 2010 Census,” Issue Brief No. 12 (Durham, NH: Carsey Institute, University of New Hampshire, 2010).
10. O’Hare, 2010.
11. M. De La Puente, Census 2000 Testing, Experimentation, and Evaluation Program, Census 2000 Ethnographic Studies, TR-15 (Washington, DC: U.S. Census Bureau, 2004), 12, available at http://www.census.gov/pred/www/rpts/TR15.pdf.
12. K. Pollard and L. Jacobsen, “The Appalachian Region: A Data Overview From the 2010–2014 American Community Survey—Chartbook” (Washington, DC: Population Reference Bureau, 2016), Table 2.1.
13. W.P. O’Hare, S. Romalewski, and K. Pollard, “Hard-to-Count Population in Appalachia,” presentation at the Southern Demographic Association Conference, Morgantown, WV, October 26, 2017.
14. O’Hare et al., 2017.
15. National Center for Farmworker Health, “Farmworker Health Factsheet: Demographics,” 2012, http://www.ncfh.org/uploads/3/8/6/8/38685499/fs-migrant_demographics.pdf.
16. U.S. Department of Agriculture, “Background,” 2012, 12, ers.usda.gov/topics/farm-economy/farm-labor/background.aspx.
17. E. Kissam, “Differential Undercount of Mexican Immigrant Families in the U.S. Census,” Statistical Journal of the IAOS 33 (2017): 797–816; S. Gabbard, E. Kissam, and P.L. Martin, “The Impact of Migrant Travel Patterns on the Undercount of Hispanic Farm Workers,” paper presented at the Research Conference on Undercounted Ethnic Populations, U.S. Census Bureau, Washington DC, May 1993.
18. M.D. Montoya, “Ethnographic Evaluation of the Behavioral Causes of Undercount” (prepared under Joint Statistical Agreement 90-06 with the University of Oregon, Bureau of the Census, Washington, DC, 1992); Aguirre Division of JBS International, “2010 Census Enumeration of Immigrant Communities in Rural California: Dramatic Improvements but Challenges Remain” (Burlingame, CA: JBS International, 2012); Gabbard et al., 1993; Aguirre Division of JBS International, “Identifying High Concentrations of Migrant and Seasonal Farmworkers,” prepared for the U.S. Census Bureau (Burlingame, CA: Aguirre Division of
JBS International, 2007).
19. U.S. General Accounting Office, “Decennial Census: Lessons Learned for Locating and Counting Migrant and Seasonal Farm Workers,” GAO-03-605, report to the Ranking Minority Member, Committee on Government Reform, House of Representatives, July 2003, 1.
20. U.S. Census Bureau, “Respondent Confidentially Concerns and Possible Effects on Response Rates and Data Quality for the 2020 Census,” presentation by Mikelyn Meyers at the Census Bureau National Advisory Committee Meeting, November 2, 2017.
21. Census Project, “2020 Census Funding Increase Needed Urgently,” 2017, https://thecensusproject.org/category/census-budget-issues/.
22. Office of the Auditor General of Canada, “Chapter 8—Meeting Needs for Key Statistical Data: Statistics Canada,”2014 Spring Report of the Auditor General of Canada, 2014, http://www.oag-bvg.gc.ca/internet/English/parl_oag_201405_08_e_39339.html.
23. U.S. Department of Commerce, “The Value of the American Community Survey: Smart Government, Competitive Businesses, and Informed Citizens,” Economics and Statistics Administration, Office of the Chief Economist, Washington, DC, 2015, 11.
24. U.S. Census Bureau, “American Community Survey: Mandatory vs. Voluntary Methods,” U.S. Census
Bureau Blog, March 16, 2017.
25. U.S. Census Bureau, “2020 Census Operational Plan,” 2017.
26. W.P. O’Hare and T. Lowenthal, “The 2020 Census: The Most Difficult in History?” Applied Demography Newsletter, Fall 2015.
27. A. Tomer, E. Kneebone, and R. Shivaram, “Signs of Digital Distress: Mapping Broadband Availability and Subscription in American Neighborhoods” (Washington, DC: Brookings Institution, 2017).
28. Institute for Rural Journalism and Community Issues, “Rural Areas Risk Being Undercounted in the 2020 Census,” The Rural Blog, 2017, p. 1, http://irjci.blogspot.com/2017/10/some-rural-areas-risk-being.html.
29. U.S. Government Accountability Office, “2020 Census: Actions Needed to Mitigate Key Risks Jeopardizing a Cost-Effective Enumeration,” testimony by Gene L. Dodaro before the Committee on Homeland Security and Government Affairs, U.S. Senate, October 31, 2017.
30. D. Alexander, “Briefing on American Indian Alaska Natives, 2020 Tribal Consultation Meetings,” National Advisory Committee Spring Meeting, Washington DC, U.S. Census Bureau, 2017, Slide 18.
31. U.S. Census Bureau, “The Effect of Adding an Internet Response Option to the American Community Survey,” 2014 American Community Survey Research and Evaluation Report Memorandum Series ACS14-RER-2 (Washington, DC: Census Bureau, 2014); U.S. Census Bureau, 2015.
Acknowledgements
The author thanks Michael Ettlinger, Curt Grimm, Michele Dillon, Amy Sterndale, Ken Johnson, Marybeth Mattingly, Laurel Lloyd, and Bianca Nicolosi at the Carsey School of Public Policy and Patrick Watson for substantive comments and editorial contributions.