Key Findings
Recent National Center for Health Statistics birth data indicate there were only 3,661,000 births in 2022, compared to 3,664,000 in 2021, and just 3,614,000 in 2020. These three birth cohorts are the smallest in 40 years and continue a birth decline that began in the era of the Great Recession. The extent of this 15-year trend is reflected in the fact that there were 655,0000 fewer births in 2022 than in 2007—a 15.1 percent decrease—even though the number of women in their prime childbearing years (aged 20–39) rose by 9.4 percent. Births diminished because fertility rates declined significantly among women in their teens and twenties. Fertility rate declines were substantial for these younger women regardless of race and ethnicity. Fertility rate changes were smaller among women over 30, diminishing slightly among women in their early 30s and increasing modestly among women 35 to 49. However, fertility gains among older women were too small to offset the significant fertility declines among younger women. The long-term impact of the fertility decline has been substantial. Had 2007 fertility patterns been sustained through 2022, there would have been 9.6 million more births in the last 15 years (see figure). Factors including diminished immigration, later marriage and childbearing, greater educational and employment opportunities for women, and limited access to childcare and family leave likely contributed to the fertility declines. A critical long-term question is: how many of these births are being delayed, and how many will be foregone? Women who delayed fertility because of the Great Recession were further challenged by COVID-19, and many are approaching the end of their childbearing years. This has implications for health care, schools, child-related businesses, and eventually for the labor force.
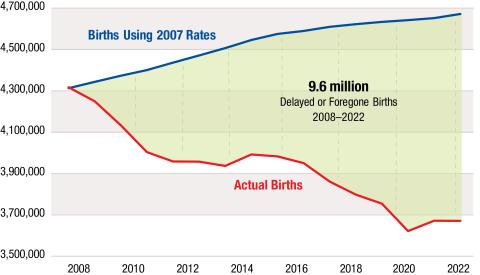
Source: National Center for Health Statistics, 2023

Kenneth M. Johnson is senior demographer at the Carsey School of Public Policy, professor of sociology at the University of New Hampshire, and an Andrew Carnegie Fellow. The opinions are his and not those of the sponsoring organizations. The research assistance of Tyrus Parker is gratefully acknowledged.