Key Findings
The U.S. population grew by just 1,838,000 (0.55 percent) between April 2020, when the 2020 Census was collected, and July 2022, according to recent Census Bureau estimates. This was the smallest two-year percentage increase in history. There have been just 431,000 more births than deaths since the 2020 Census. Historically (between 1950 and 2019), the smallest single-year excess of births over deaths was 923,000 between July 2018 and July 2019. Covid played a central role in the minimal natural increase and the modest population gain of the period. In addition to 1 million deaths directly attributable to Covid during the period, it increased mortality by hindering people’s access to treatment for other health conditions and increased deaths of despair.1 Because the natural gain was so small, immigration from abroad (also diminished because of COVID and other factors) accounted for 80 percent of the minimal population gain.
Deaths Exceeded Births in Nearly 75 Percent of U.S. Counties, but 52 Percent Still Gained Population
The demographic forces that diminished U.S. population growth also influenced individual county population changes, though there is an important difference. While the nation’s migration gain comes entirely from net immigration from other countries, county migration gains or losses also include domestic migration—people moving between counties. In fact, such domestic migration has a far bigger impact on most counties’ demographic trends than international migration. Therefore, county population change depends on the balance between births and deaths, but also the net movement of people into and out of the county both from immigration and domestic migration. In all, 52 percent of the 3,143 U.S. counties gained population between April 2020 and July 2022.
Covid’s grim impact on U.S. mortality caused significantly more deaths than in prior years. Deaths exceeded births in nearly 75 percent of all U.S. counties in each of the last two years. Such a widespread incidence of deaths exceeding births (natural decrease) is unprecedented (Figure 1). Many of the factors causing natural decrease predate the pandemic. Deaths tend to exceed births in counties where the population is older, there are few women of childbearing age, and fertility rates are low. However, Covid has expanded its incidence to regions with no history of natural decrease, by increasing mortality among older populations, many of whom have preexisting conditions and limited access to health care, especially in rural areas.
The excess of births over deaths has long been the primary driver of population growth in counties and states. Yet amid 75 percent of counties experiencing an excess of deaths over births, a remarkable 52 percent of all U.S. counties still gained population during the period. Most of the population growth that did occur was due to migration. Nearly 63 percent of all counties had more people move in than leave. Most of this was domestic migration; people moving from one U.S. county to another. This was especially true during the first year of the period when immigration was at a low ebb.
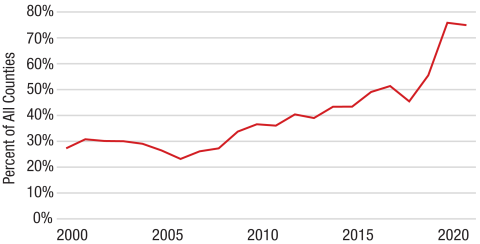
Source: U.S. Census Bureau Population Estimates. Analysis: K.M. Johnson, Carsey School, University of New Hampshire.
The combination of natural increase (or decline) and net migration gain (or loss) produced a patchwork of population loss and gain across the United States (Figure 2). Among the 3,143 counties, 25 percent lost population because there were more deaths than births, and a migration loss (dark red counties). In contrast, in 35 percent of the counties, the population grew because they gained enough migrants to offset a loss due to more deaths than births (light green counties). Here the critical role of the widespread net migration gain is evident; without it, all these counties would have lost population. Population losses were widespread in the Rust Belt, in the Great Plains, and in the Mississippi Delta. Population gains were common in the Southeast, Eastern Texas and Oklahoma, and in much of the West.
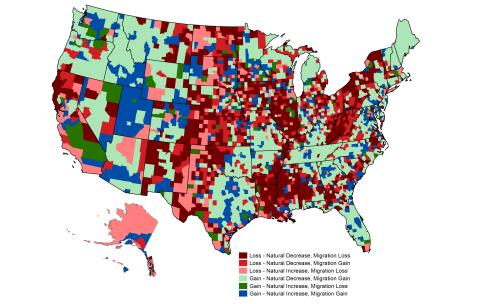
Source: U.S. Census Bureau Population Estimates. Analysis: K.M. Johnson, Carsey School, University of New Hampshire.
The Pandemic Altered Population Redistribution Trends in Both Rural and Urban America
The turbulent economic, social, and epidemiological conditions fostered by COVID altered traditional demographic trends in both metropolitan and nonmetropolitan America. Between 2010 and 2020, nonmetropolitan (rural) America lost population because more people left rural areas than moved to them and because the excess of births over deaths dwindled. Yet, there is evidence of renewed population gains in many parts of nonmetropolitan America between April 2020 and July 2022 (Figure 3).2 This modest nonmetropolitan population increase occurred because a net migration gain offset the growing excess of deaths over births fostered by the pandemic. Migration gains occurred in nearly 59 percent of all nonmetropolitan counties recently, compared to just 33 percent of these counties in the previous decade.
Figure 3. Demographic Change by Metropolitan Status, 2020 to 2022
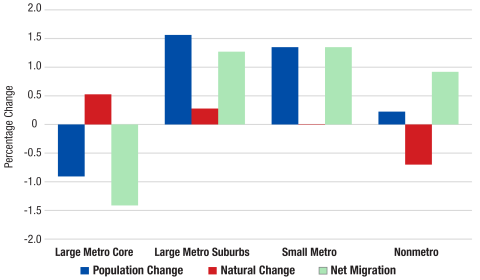
Source: U.S. Census Bureau Population Estimates. Analysis: K.M. Johnson, Carsey School, University of New Hampshire.
Most of the recent nonmetropolitan population increase accrued to high amenity recreational and retirement areas. Net migration gains to these counties accelerated during the pandemic because people migrated in from urban areas, but also because fewer people left. Elsewhere in rural America, longer-term population loss continued, because 85 percent of rural counties had more deaths than births. In many rural counties with histories of population loss, only sustained net migration gains can provide the demographic lifeline they need to stave off depopulation. Whether these nonmetropolitan migration gains will continue in this turbulent era remains to be seen.
In the dense urban core counties of the nation’s metropolitan areas of 1 million or more, the migration story is different. Nearly two-thirds of these counties experienced a population loss during the period, even though nearly 85 percent continued to have more births than deaths despite Covid. Nearly 75 percent of these counties experienced net outmigration. The net migration loss of 1.4 million from large urban core counties occurred because of a net outflow of nearly 2 million migrants to other areas of the United States, which far exceeded the gain from immigration. This net outflow of domestic migrants from large urban core counties contributed to net migration gains that produced population increase in the suburban counties of these large metropolitan areas and in smaller metropolitan areas. The net result of these trends was population loss in the urban core counties of large metropolitan areas, population increase in the suburban areas of large metropolitan areas and smaller metropolitan areas, and modest population increase in some nonmetropolitan areas.
Looking ahead, the size and distribution of future population gains remain uncertain. As the impact of the pandemic wanes, the excess of births over deaths is likely to increase, resulting in a larger natural gain. How large this gain will be depends on future fertility. The excess of births over deaths was already dwindling before the onset of the pandemic because of population aging and low fertility. Birth rates during the pandemic remained near historical lows, continuing a trend that began with the Great Recession. Whether fertility rates will increase in the aftermath of the pandemic is uncertain.
The other key question is what will happen to migration, both domestic and immigration. Recent data reflect accelerated immigration during the second year of the pandemic, which if sustained, will increase future population gains. Domestic migration, which accounts for the recent nonmetropolitan population gain, as well as the population loss from the largest urban core counties, is also in flux. Domestic migration documented here included a movement of population from dense urban places to suburban areas, and to nonmetropolitan counties with recreational and retirement-related amenities. How much of that movement was temporarily fostered by pandemic-era flexibility that allowed more people to work from remote places, and how much represents an actual change in residential preferences remains to be seen. Data for the second year of the pandemic reflect diminished domestic migration losses from the large urban cores, which may suggest a return to pre-Covid migration patterns. While much about the nation’s demographic future remains uncertain, it is clear that the pandemic altered U.S. mortality and migration trends and at least temporarily influenced population redistribution trends across the entire rural-urban continuum.
Methods and Data
This analysis is based on data from the Census Bureau Population Estimates Program, April 1, 2020, to June 30, 2022. Readers should recognize that although the Bureau uses the best data and algorithms available at the time of release to generate the data, they remain estimates. Concerns remain about both the quality of the 2020 Census for subnational areas and populations, and about the impact of the Differential Privacy algorithms on its accuracy.
- A.M. White, I.P. Castle, P.A. Powell, R.W. Hingson, and G.F. Koob, “Alcohol-Related Deaths During the COVID-19 Pandemic,” JAMA, 327(17) (2022): 1704–1706. https://jamanetwork.com/journals/jama/fullarticle/2790491.
- Connecticut is not included in Figure 3 because under its recently redefined county structure counties have not yet been assigned a metro status.

Kenneth M. Johnson is senior demographer at the Carsey School of Public Policy, professor of sociology at the University of New Hampshire, and an Andrew Carnegie Fellow. This research is supported by the NH Agricultural Experiment Station through joint funding from the USDA National Institute of Food and Agriculture (under Hatch-Multistate project W-5001, award number 7003437) and the state of New Hampshire. The opinions are his and not those of the sponsoring organizations. The GIS work of Barb Cook is gratefully acknowledged.