download the brief
Key Findings


Over the last two decades, opioid1 overdose deaths have increased over 400 percent, reaching 45,838 in 2016.2 Although the crisis is not disproportionately worse in rural3 than in urban America, opioid mortality rates have grown faster in rural areas, particularly in the Northeast and Midwest. Rural areas also face unique challenges in dealing with the crisis, including a smaller health care infrastructure than is available in more densely populated areas, community and family factors, and labor market stressors.
Rural-Urban Differences in Opioid Mortality
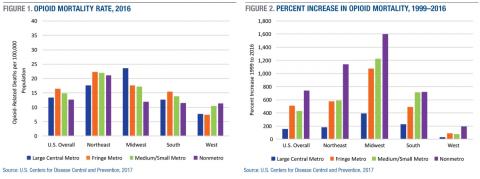
In 2016, opioid mortality rates were higher, on average, in urban than in rural counties (Figure 1), with rates of 13.4 deaths per 100,000 in large central metro counties, 16.4 in large fringe metro counties, 14.8 in medium/small metro counties, and 12.6 in nonmetro counties (see Box 1 for a definition of these designations). Large central metro counties in the Midwest have the highest rate overall at 23.6, twice the rate of nonmetro Midwestern counties (11.9). The West has the lowest rates overall, but nonmetro counties in the West have comparable rates to nonmetro counties in the South and Midwest. Among nonmetro counties, those in the Northeast have the highest opioid mortality rates by far (21.1), nearly double the rates in nonmetro counties in each of the other regions.
Although overall rates are higher in urban than in rural counties, rates increased more in rural than in urban counties across all regions over the last two decades (Figure 2). Between 1999 and 2016, the rate increased by 158 percent in large central metro counties, 507 percent in large fringe metro counties, 429 percent in medium/small metro counties, and 740 percent in nonmetro counties. The largest increases occurred in the rural Midwest (1,600 percent) and rural Northeast (1,141 percent).
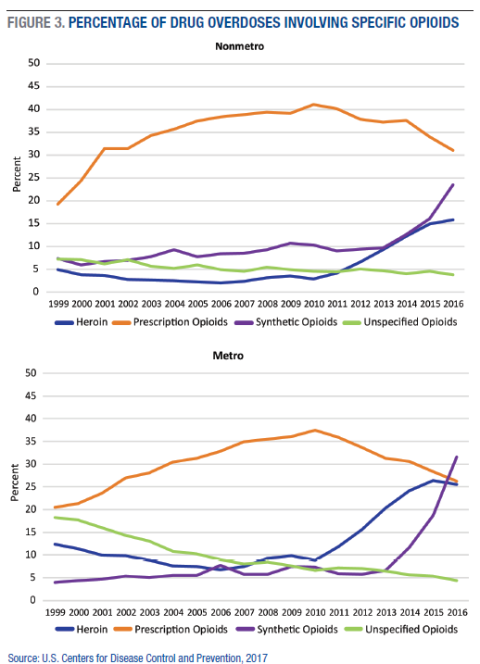
In rural areas, prescription opioids contribute to a larger share of drug overdose deaths than either heroin or synthetic opioids (Figure 3). In 2016, prescription opioids were involved in 31 percent of drug overdose deaths in nonmetro counties, compared to 24 percent for synthetic opioids and 16 percent for heroin. In metropolitan counties, synthetic opioids were involved in 32 percent of drug overdose deaths, while heroin and prescription opioids were each involved in 26 percent. In both urban and rural areas, the contribution of prescription opioids to drug overdose deaths has declined since 2010, while the share of deaths involving heroin or synthetic opioids has increased dramatically. Importantly, the majority of drug overdoses involve multiple types of drugs, and alcohol is often a contributing factor. For example, in 2016, two-thirds of drug overdoses involved more than one type of opioid (for example, prescription and heroin; heroin and fentanyl), 11 percent involved both cocaine and at least one opioid, and 15 percent involved benzodiazepines and at least one opioid. Moreover, the specific drugs involved are not identified for many drug overdoses, meaning that the actual share of drug overdoses that involve opioids is undercounted.4
The Geography of Rural Opioid Mortality
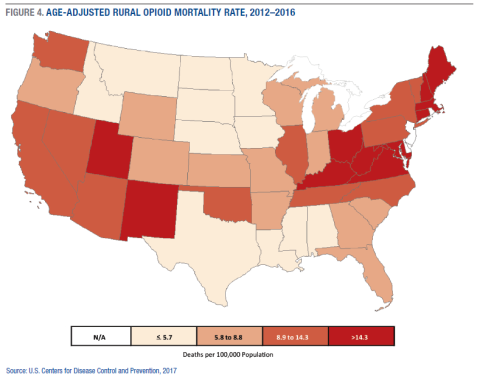
Figure 4 shows the combined rate for all nonmetro opioid deaths in the contiguous forty-eight states. Nonmetro opioid mortality rates are highest throughout central Appalachia, New England, New Mexico, and Utah, and lowest in the South and upper Great Plains. Collectively, the rural counties in West Virginia had the highest rural opioid mortality rate of all states in 2012–2016 (32.3 deaths per 100,000 population), followed by Connecticut (20.4), Kentucky (19.5), New Hampshire (19.1), and New Mexico (18.6). Rural mortality rates were very low in Nebraska (2.2), Alabama (3.0), Louisiana (3.9), South Dakota (3.9), and North Dakota (4.0). Since the early 2000s, the largest increases in rural opioid mortality rates have been in New York (1,500 percent), Ohio (918 percent), Pennsylvania (644 percent), Wisconsin (577 percent), and Indiana (554 percent).
Rural Challenges for Dealing With the Opioid Crisis
Even though opioid mortality rates are not disproportionately higher in rural America, rural areas face unique infrastructural, social, and economic challenges when dealing with the crisis.
Infrastructural challenges include disproportionately fewer clinics and hospitals and less access to mental health treatment, drug treatment, prevention, and harm reduction programs.
In terms of social factors, stigma, family ties, and community interactions create important challenges for rural areas. Although stigma is not unique to rural communities, it can be especially pronounced in small towns. Difficulty maintaining anonymity in communities where “everyone knows everyone” can sometimes cause people to discontinue treatment or avoid it altogether.5 On average, rural communities may be strengthened by their comparatively higher levels of community attachment and social interaction and social support, but there is wide divergence in these social resources across the United States. The lack of recreational opportunities (such as parks and after-school programs) is a known risk factor for youth substance use.6 Although strong family support can improve the odds of recovery, social and family networks in rural areas also facilitate prescription drug diversion (sharing, trading, selling). Indeed, in regions with widespread and intergenerational economic disadvantage, like rural Appalachia, opioids sometimes serve as a form of currency.7
The two-decade increase in opioid mortality has corresponded with significant economic stressors in some rural areas. Rural labor markets are less diversified than urban ones, making them more vulnerable to economic shifts. Over the past 40 years, employment restructuring has led to the movement of many livable-wage production jobs out of rural areas, while high-wage, high-skill service, ?nance, and technology-based employment has become more concentrated in urban cores.8 This shift has resulted in fewer and lower-wage employment opportunities for rural residents.9 Unstable labor markets contribute to substance misuse. Selective out-migration of highly-skilled and college-bound young adults10 has intensified the geographic clustering of multigenerational economic distress in many rural areas, making it difficult for these places to muster the financial and human capital to fight back against the opioid scourge.
Where Do We Go From Here?
As with other measures of well-being, there is substantial variation in the opioid problem across rural America. Failing to account for this variation may lead to the misdirection of resources and inappropriate policy solutions. Policy initiatives thus far have been largely ineffective at addressing the opioid crisis in many of the hardest-hit rural communities, and the recent surge in fentanyl overdoses in large urban areas may be a precursor of what to expect in at-risk rural communities in the coming years.
Strategies for addressing the opioid crisis must consider treatment, recovery, harm reduction, and prevention. Thus far, strategies have disproportionately focused on downstream efforts aimed at treating persons addicted to opioids or quelling the supply of prescription opioids. Upstream approaches—like evidence-based, school-based prevention programs—are lacking in rural areas.11 Economic development is also sorely needed in many of the rural areas hit hardest by the opioid crisis. It is no coincidence that overdose rates are highest in places with the most disadvantaged labor markets that have hemorrhaged jobs over the past three decades.12 Existing interventions are unlikely to be effective without addressing the underlying social and economic determinants, including poverty, unemployment, and declining opportunities for upward mobility, that are plaguing the hardest-hit areas.
Data
Data are from the U.S. Centers for Disease Control and Prevention’s Wide-Ranging Online Data for Epidemiologic Research (WONDER) multiple cause-of-death (MCD) files, 1999–2016. Specific causes of opioid-related death are detailed in the peer-reviewed article.13 All rates are age-adjusted and represent the number of deaths per 100,000 population.
Box 1: Definitions
Urban-rural classification is based on the National Center for Health Statistics 2013 Urban-Rural Classification Scheme for Counties. “Large central metro” are counties in metropolitan statistical areas (MSA) of 1 million or more population that (1) contain the entire population of the largest principal city of the MSA, or (2) are completely contained within the largest principal city of the MSA, or (3) contain at least 250,000 residents of any principal city in the MSA. “Large fringe metro” are remaining counties in MSAs of 1 million or more that do not qualify as central metro. “Medium/small metro” are counties in MSAs of less than 1 million population. “Nonmetro” are counties not included in an MSA.
Endnotes
1. Opioids include prescription opioid pain relievers, methadone, heroin, and synthetic opioids (for example, fentanyl).
2. Data are from the U.S. Centers for Disease Control and Prevention, National Center for Health Statistics, “Multiple Cause of Death 1999–2016,” 2017, https://wonder.cdc.gov/mcd-icd10.html.
3. Throughout we use metropolitan and urban, and nonmetropolitan and rural, interchangeably.
4. C.J. Ruhm, “Corrected US Opioid-Involved Drug Poisoning Deaths and Mortality Rates, 1999–2015,” Addiction 113, no. 7 (2018): 1139–1344.
5. T.F. Borders and B.M. Booth, “Research on Rural Residence and Access to Drug Abuse Services: Where Are We and Where Do We Go?” Journal of Rural Health 23, Suppl. 1 (2017): 79–83.
6. K.T. Van Gundy, N.F. Stracuzzi, C.J. Rebellon, C.J. Tucker, and E.S. Cohn, ”Perceived Community Cohesion and the Stress Process in Youth,” Rural Sociology 76, no. 3 (2011): 293–318.
7. A.B. Jonas, A.M. Young, C.B. Oser, C.G. Leukefeld, and J.R. Havens, “OxyContin® as Currency: OxyContin® Use and Increased Social Capital Among Rural Appalachian Drug Users,” Social Science & Medicine 74, no. 10 (2012): 1602–9.
8. C. Bailey, L. Jensen, and E. Ransom, Rural America in a Globalizing World: Problems and Prospects for the 2010s (Morgantown, WV: West Virginia University Press, 2014).
9. T. Slack, “Work in Rural America in the Era of Globalization,” in C. Bailey, L. Jensen, and E. Ransom, eds., Rural America in a Globalizing World: Problems and Prospects for the 2010s (Morgantown, WV: West Virginia University Press, 2014).
10. P.J. Carr and M.J. Kefalas, Hollowing Out the Middle: The Rural Brain Drain and What It Means for America (Boston, MA: Beacon Press, 2009).
11. J. Gale, A. Hansen, and M. Williamson, “Rural Opioid Prevention and Treatment Strategies: The Experience in Four States,” April 2017, https://muskie.usm.maine.edu/Publications/rural/WP62-Rural-Opioid-Prevention-Treatment-Strategies.pdf.
12. S.M. Monnat, “Factors Associated With County-Level Differences in U.S. Drug-Related Mortality Rates,” American Journal of Preventive Medicine 54, no. 5 (2018): 611–19.
13. K.K. Rigg, S.M. Monnat, and Melody N. Chavez, “Opioid-Related Mortality in Rural America: Geographic Heterogeneity and Intervention Strategies,” International Journal of Drug Policy 57 (2018): 119–29.
Acknowledgements
The authors thank Michele Dillon, Beth Mattingly, and Laurel Lloyd for helpful suggestions on earlier drafts. Dr. Monnat acknowledges funding from the USDA Economic Research Service, USDA AFRI, and the Institute for New Economic Thinking, as well as support from the W-4001 Committee, which is funded by the Western Association of Agricultural Experiment Station Directors (WAAESD). The views expressed in this brief represent those of the authors and should not be attributed to these funding agencies.