Key Findings
Once again, New Hampshire’s U.S. Senate contest is one of a handful that will determine control of Congress. The electorate that will choose between Democratic incumbent Maggie Hassan and Republican challenger Don Bolduc is quite different than the one Hassan faced just six years ago, when she won by only 1,017 votes. Nearly 28 percent of potential Granite State voters on November 8th were either too young to vote or did not live in New Hampshire in 2016. This figure underscores the rapid, substantial turnover among New Hampshire voters, an important point often overlooked by pundits and prognosticators. In fact, New Hampshire’s population is among the most mobile in the nation: two-thirds of residents aged 25 and older were not born in the state. Nineteen percent of today’s potential voters resided somewhere other than New Hampshire in 2016; in addition, just over 8 percent were not old enough to vote six years ago (Figure 1). Such migration, coupled with natural population change, as young voters come of age and older generations of voters pass from the scene, has altered the voting population considerably. The young potential voters tend to be more liberal than the 72 percent of potential voters who were already established here in 2016 (Figure 2). However, most of the voters new to New Hampshire are recent migrants to the state, who tend to be less liberal than young voters and more like the state’s established voters. Given the narrow margins common in many recent New Hampshire elections, these new voters could have a significant impact on the 2022 election results.
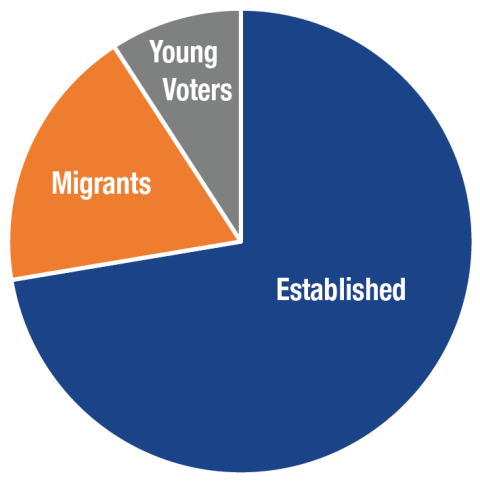
Note: Young voters aged 18–23 in 2022. Migrant voters moved to New Hampshire between 2017–2022.
Source: U.S. Census Population Estimates 2017–2021 and American Community Survey 2017–2021.
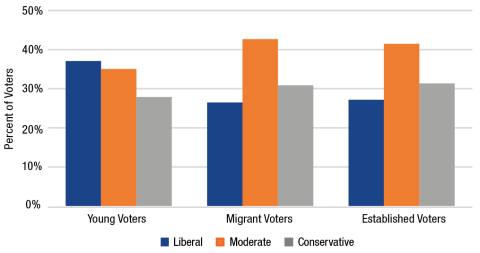
Source: Granite State Polls 2017–2020, University of New Hampshire
About the Authors
- Kenneth M. Johnson is senior demographer at the Carsey School of Public Policy, professor of sociology at the University of New Hampshire, and an Andrew Carnegie fellow.
- Andrew Smith directs the Survey Center at the University of New Hampshire and is a professor of practice in political science at the University of New Hampshire.
- Dante J. Scala is professor of political science at the University of New Hampshire and a fellow at the Carsey School of Public Policy.