Key Findings
The U.S. population grew by a modest 7.4 percent during the past decade to 331.4 million in April 2020. Yet, there was significant variation in the rate and direction of population change among the numerous racial and Hispanic origin groups that together represent the U.S. population. The net result was a significant increase in racial diversity over the course of the decade, both in the population as a whole, and children in particular.
The growing diversity of the population during the decade reflects differential patterns of demographic change among the numerous sub-groups within the U.S. population. The largest racial group remains non-Hispanic Whites. In all, 57.8 percent of the nation’s residents (191.7 million) reported to the Census Bureau that they were White alone and not of Hispanic origin on the 2020 Census. This is 5.1 million fewer than in 2010, when the non-Hispanic White population was 63.7 percent of the U.S. total. The primary cause of growing U.S. diversity was a 24.9 percent population gain among groups other than non-Hispanics Whites. Together these groups now number 139.8 million people and represent 42.2 percent of the U.S. population compared to 36.3 percent in 2010 and 30.5 percent in 2000. Hispanics represent the largest share of this growing population with 62.1 million residents, or 18.7 percent of the population (Figure 1). The Census also enumerated 33.9 million non-Hispanic Blacks representing 12.1 percent of the population, and 19.6 million (5.9 percent) non-Hispanic Asians. The largest percentage gain was among multiracial non-Hispanic residents, who at 13.5 million, now represent 4.1 percent of the population. The population reporting that they were Native Peoples (2.9 million) or of “some other race” (1.7 million) also increased; together, these two groups now represent 1.4 percent of the population.
Children in the Vanguard of Growing Diversity
Children are at the leading edge of the nation’s growing diversity. In all, 52.7 percent of U.S. population under age 18 belonged to a minority group in 2020 compared to 39.2 percent of the population over age 18. The greater diversity among children is the result of two diverging trends. Over the past decade, the minority child population increased by 11.8 percent to 38.5 million, despite a modest decline in the number of non-Hispanic Black children. During the same period, the non-Hispanic White child population diminished by 12.9 percent to 34.6 million. Overall, the U.S. child population declined by 1.1 million (-1.4 percent) between 2010 and 2020, because the youth gain among other groups was not sufficient to offset the non-Hispanic White and Black loss.
Hispanics represent 25.7 percent of the under 18 population compared to 16.8 percent of the population over 18 (Figure 2). The multiracial child population also includes a larger share of the child population (6.7 percent) than of the adult population (3.3 percent). A similar pattern exists among non-Hispanic Blacks, Native Peoples, and those of “some other” races. Only non-Hispanic Whites and Asians comprise a smaller share of the nation’s child population than of the adult population.
Figure 1. U.S. Population by Race and Hispanic Origin, 2020
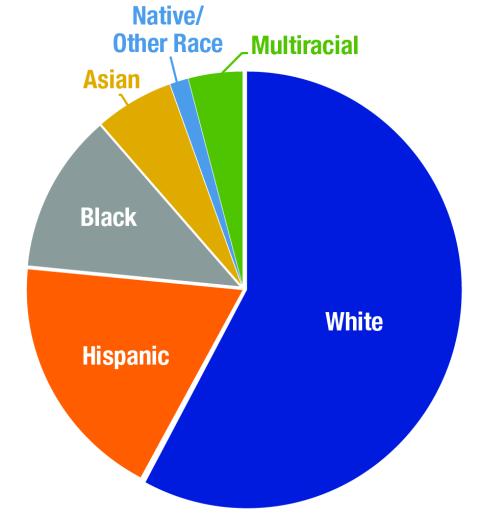
Note: “Native/Other Race” category includes individuals who report native origins as well as those who report “some other race.” Source: U.S. Census 2020. Analysis: K.M. Johnson, Carsey School, University of New Hampshire.
Figure 2. U.S. Population by Age, Race, and Hispanic Origin, 2020
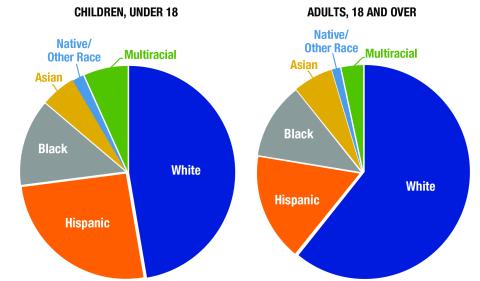
Note: “Native/Other Race” category includes individuals who report native origins as well as those who report “some other race.” Source: U.S. Census 2020. Analysis: K.M. Johnson, Carsey School, University of New Hampshire.
Considerable Geographic Variation in Diversity
Racial-ethnic diversity is geographically uneven across the United States. In many areas of the country, diversity is widespread. For example, in much of the South and West, as well as in large urban areas nationwide, the population is quite diverse both among adults and children. This is reflected in the yellow and orange areas of Figures 3 and 4. Here the likelihood that two residents of the same county will be of a different race or Hispanic origin is high. In contrast, in much of New England, the Great Lakes, and the Northern Great Plains, the population is far more homogeneous, as reflected in the blues and greens on the map.
The maps also underscore the greater diversity among the children than adults. In every region of the country, child diversity is greater than that of the adult population. The chances that two randomly selected U.S. children will differ in race/Hispanic origin is 69 percent compared to 58 percent among those over 18. In fact, the child population is more diverse than the adult population in 47 of the 51 states (including DC) and in two of the remaining four states the differences are minimal.
Figure 3. Racial Diversity of Population, Ages 0–17, 2020
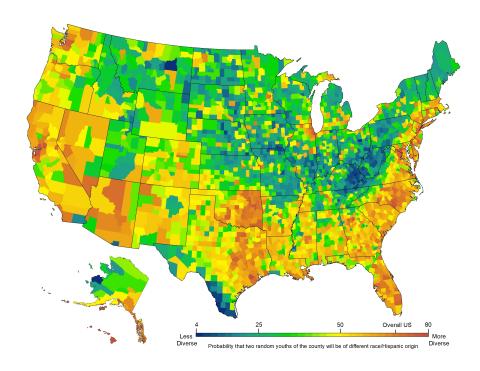
Source: U.S. Census 2020.
Figure 4. Racial Diversity of Population, Ages 18+, 2020
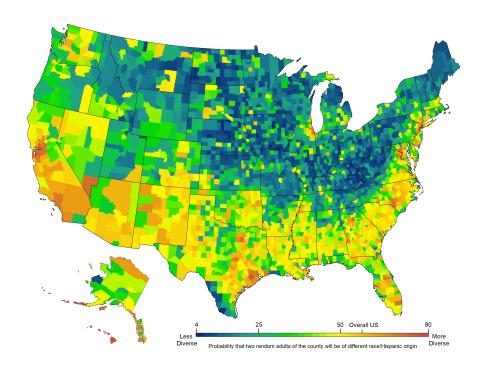
Source: U.S. Census 2020.
Growing Diversity Expands Opportunities for Multiracial Interaction, Especially Among Children
The nation’s growing racial-ethnic diversity increases the likelihood of interaction across racial boundaries in the workplace and community. This is reflected in the growing incidence of intermarriage among racial groups and the rapid increase in the number of multiracial children. However, the spatial unevenness of diversity suggests that opportunities for racial and ethnic interaction will vary from place to place. Because diversity is growing the most among those under age 18, youth centered institutions—such as schools and health care providers—have been the first to serve a diverse population. The growing diversity of the nation’s youngest residents gives them a greater opportunity to grow up in multiracial and multiethnic communities that will enhance interracial relations, widen friendship networks, and prepare them for life in an increasingly diverse nation.
Methods and Data
Data are from the 2020 and 2010 Decennial Census. Race and Hispanic origin are defined separately in the Census and self-reported by respondents. In this paper, the population is divided into: Hispanic of any race; non-Hispanic White alone; non-Hispanic Black Alone; non-Hispanic Asian Alone; non-Hispanic Native Peoples or those of Some Other Race Alone; and non-Hispanics of Two or More Races (multiracial). Spatial diversity is measured as the probability that two randomly selected individuals in an area will be of a different racial-Hispanic origin group and is calculated using the six groups mentioned above. Changes in Census Bureau procedures make it difficult to directly compare the racial categories in the 2020 Census to those in the 2010 Census. Concerns about both the quality of the 2020 Census and the impact of the Census Bureau’s Differential Privacy algorithms on the accuracy of the 2020 Census remain unresolved at this time.
About the Author

Kenneth M. Johnson is senior demographer at the Carsey School of Public Policy, professor of sociology at the University of New Hampshire, and an Andrew Carnegie Fellow. His research was supported by the New Hampshire Agricultural Experiment Station in support of Hatch Multi-State Regional Project W-4001 through joint funding of the National Institute of Food and Agriculture, U.S. Department of Agriculture, under award number 1013434, and the state of New Hampshire. The opinions are his and not those of the sponsoring organizations. The research assistance of Kristine Bundschuh and GIS work of Barb Cook are gratefully acknowledged.