download the brief
Key Findings


America is growing more racially and ethnically diverse,1 yet some parts of the country are far more diverse than others. Migration—the flow of people from one place to another2—influences local diversity by continually redistributing the population3 and altering the racial mix in both the sending and receiving communities. Migration can serve an integrating function when people from different races move into the same area, but it can also reinforce existing racial boundaries and diminish local diversity when people from different racial groups sort themselves into homogeneous communities.
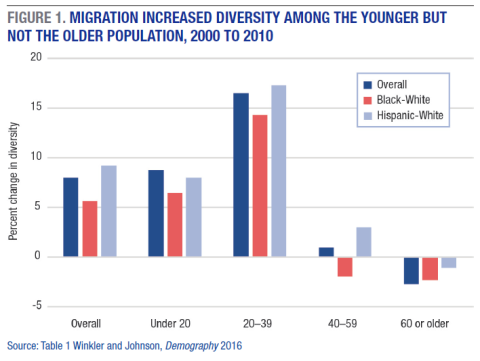
Using new data and techniques, we find that net migration between counties increased racial diversity in each of the last two decades. However, migration’s influence on diversity was far from uniform: it varied by race, age group, and region of the country, sometimes starkly. Overall, net migration of the population under age 40 increased diversity, while net migration of people over age 60 diminished diversity (see Figure 1 and Box 1).4
Blacks and Hispanics of all ages migrated to areas that were “whiter,” thereby increasing diversity. The movements of the white population have been more complex, however, with impacts that vary considerably by age. White young adults (age 20–39) moved from predominantly white counties to counties with larger black and Hispanic population shares, often in large urban centers. The net flow of white young adults into central-city counties increased the white young adult population there by approximately 20 percent in the 1990s and again in the 2000s.5 The outflow of these same young white adults from suburban and rural counties to big urban cores also contributed to more diversity in these origin areas by diminishing the number of whites there. In contrast, whites at family ages (children and adults age 40–59) tended to move from less white to more white counties, a shift often associated with suburbanization or exurbanization. Whites over age 60 also tended to move from relatively more diverse counties to whiter counties. Combined with relatively little county to county migration among blacks and Hispanics at older ages, this meant that net migration of people age 60 and over homogenized the population. Ultimately, migration produced counties with more diverse younger populations by increasing the intermix of people from various race and ethnic backgrounds. Yet migration caused older adults (age 60-plus) to become more separated from one another by race and Hispanic origin.
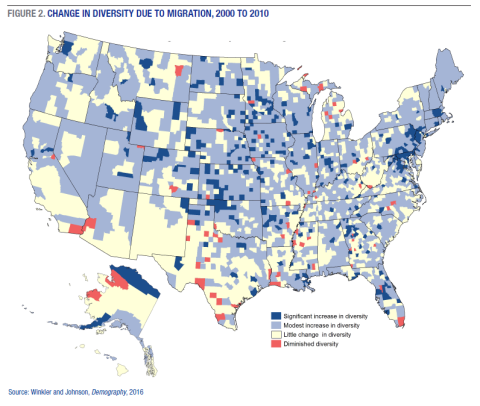
On the whole, the combination of people of color at all ages migrating into predominantly white counties and white young adults moving from predominantly white counties to counties with greater shares of non-whites increased overall diversity. Across the country, migration increased the diversity of the population in two-thirds of U.S. counties between 2000 and 2010 (Figure 2), but the extent varied by region and between urban-suburban-rural places. Migration increased diversity by a substantial margin in 10 percent of counties, increased it modestly in 56 percent of counties, influenced it minimally (either positively or negatively) in 32 percent of counties, and significantly diminished it in 2 percent of counties.
Migration up and down the rural-urban continuum (including suburbanization among people of color) did the most to increase diversity, while interregional migration had only a modest impact. Diversity grew the most in the suburbs and fringes of several metropolitan areas, mostly in the Northeast and Midwest. In contrast, parts of the South, Southwest, and Appalachia showed at best minimal increases in diversity from migration. Some of these counties with little diversity change were already fairly diverse, but many either had a high proportion of whites (Appalachia) or a high proportion of blacks (Mississippi Delta). Older whites appeared to be moving from relatively white suburban counties in the Midwest and Northeast toward the Sun Belt. The net result was more diversity in the counties these older whites left, because as they moved away the white population diminished, while at the same time people of color were moving in. In contrast, because the counties to which these older whites were moving were predominantly white, their influx did not increase diversity there.
Increased Diversity, Continuing Challenges
Research suggests that social mobility and acculturation contribute to the geographic dispersion of minority groups, leading to increasing diversity, yet research also suggests that significant barriers to diversity remain, including housing discrimination, density zoning, and preferences for own-group neighbors.6 We found that net migration had the overall effect of increasing diversity among U.S. counties over the past 20 years, but we also found evidence of family-age and older whites moving away from more diverse counties toward whiter ones, suggesting that factors continue to limit integration at least among some groups. That both processes (increased dispersion of minorities and continuing challenges to diversity) were underway simultaneously illustrates the intricacy of racial change in America and the ongoing role of migration in that process. Regardless of whether racial considerations are a factor impacting migration decisions (consciously or subconsciously), this research examines how migration influenced the redistribution of the U.S. population by race. Socioeconomic and policy differences influencing economic development, planning and zoning, economic displacement, and access to natural and built amenities play important roles in making counties more or less desirable and affordable to people of different racial/ethnic backgrounds at different points in their lives and in different economic circumstances. Thus, while migration contributed to the growing diversity of the nation, the process was complex and varied from place to place with significant social, economic, and political implications for both the more diverse and less diverse places.
Methods
We analyzed the impact of migration on racial and ethnic diversity using county-level net migration estimates by age, race, and Hispanic origin from 1990 to 2000 and from 2000 to 2010 for all U.S. counties. Net migration included both immigration and domestic migration (movement from one county to another). To determine the impact of net migration on racial diversity, for each racial group we compared the population at the end of the period to the population that would have been expected had only births and deaths occurred (no migration). The difference between these two represented the influence of net migration. Diversity occurs at many geographic levels, from the state to the local residential block. We focused on how migration influenced diversity at the county level because it is the lowest level of geography at which the age-specific net migration data we needed could be generated. We examined migration for non-Hispanic whites, non-Hispanic blacks, and Hispanics, because together they represent 92 percent of the U.S. population and exist in sufficient numbers to support analysis in most counties.
For more details on our data and methods as well as a more comprehensive analysis, see R.L. Winkler and K.M. Johnson, “Moving Toward Integration? Effects of Migration on Ethnoracial Segregation Across the Rural-Urban Continuum,” Demography 53, no. 4 (2016): 1027–49; and K.M. Johnson and R.L. Winkler, “Migration Signatures Across the Decades: Net Migration by Age in U.S. Counties, 1950–2010,” Demographic Research 22, no. 398 (2015):1065–80. The data used in our analysis are available at http://www.netmigration.wisc.edu/.
Box 1: Measuring Diversity
Diversity refers to how uniformly various race-ethnic groups are represented in each county’s population. In the United States as a whole in 2010, about 64 percent of the population was non-Hispanic white (hereafter “white”); about 12.2 percent non-Hispanic black (“black”); about 16.3 percent Hispanic; and about 7.7 percent self-identified as multiple races or another racial group (mostly Asian or American Indian/Alaskan Native). However, the proportion of each county’s population in each of these race/ethnic categories varies. Some counties are very diverse, with nearly equal proportions of each group. Other counties are far more homogeneous, with virtually their entire population in a single group. For example, in Queens County, NY, the population was about 28 percent white, 19 percent black, 28 percent Hispanic, and 25 percent “other,” making it the most diverse county in the country in 2010. In contrast, some Nebraska counties are not diverse at all with populations that are more than 99 percent white. Our focus in this research is on how evenly the U.S. population of different race/ethnic groups is distributed across counties, and what role migration played in changing this distribution between 1990 and 2000 and again between 2000 and 2010. For example, if Hispanic people migrated from counties in the Southwest, where they were a large proportion of the population, to new destinations in predominantly white regions of the Midwest, those moves had the potential to increase diversity both in the counties they left (by diminishing the proportion of Hispanics) and the counties they moved to (by increasing the proportion of Hispanics). In contrast, if migration moves white people from relatively diverse central-city counties in the Northeast to disproportionately white counties in Maine, diversity would diminish as like groups clustered together in the same county.
Endnotes
1. K.M. Johnson and D.T. Lichter, “Diverging Demography: Hispanic and Non-Hispanic Contributions to U.S. Population Redistribution and Diversity,” Population Research and Policy Review 35, no. 5 (2016): 705–25.
2. Net migration includes immigration, but domestic migration (movement within the United States) produces the bulk of all net migration in the United States.
3. Kenneth Johnson et al., “Temporal and Spatial Variation in Age-Specific Net Migration in the United States,” Demography 42, no. 4 (2005): 791–812; Kenneth M. Johnson, “Demographic Trends in Nonmetropolitan America: Implications for Land Use Development and Conservation,” Vermont Journal of Environmental Law 15, no. 1 (2013): 31–64; D.A. Plane, C.J. Henrie, and M.J. Perry, “Migration Up and Down the Urban Hierarchy and Across the Life Course,” Proceedings of the National Academy of Sciences of the United States of America 102, no. 43 (2005): 15313–18.
4. Diversity is measured here using the Theils H segregation index with the sign reversed.
5. K.M. Johnson and R. Winkler, “Migration Signatures Across the Decades: Net Migration by Age in U.S. Counties, 1950–2010,” Demographic Research 22, no. 38 (2015): 1065–80.
6. R.L. Winkler and K.M. Johnson, “Moving Toward Integration? Effects of Migration on Ethnoracial Segregation Across the Rural-Urban Continuum,” Demography 53, no. 4 (2016): 1027–49.
Acknowledgements
This Brief is based on R.L. Winkler and K.M. Johnson, “Moving Toward Integration? Effects of Migration on Ethnoracial Segregation Across the Rural-Urban Continuum,” Demography 53, no. 4 (2016): 1027–49. The project was supported in part by Grant Number 7R03HD069737-02 from the Eunice Kennedy Shriver National Institute of Child Health and Human Development. Dr. Johnson’s work was also supported by grants from the U.S. Department of Agriculture Forest Service, the New Hampshire Agricultural Experiment Station, and the Andrew Carnegie Fellows program of the Carnegie Corporation. The content is solely the responsibility of the authors and does not necessarily represent the official views of the Eunice Kennedy Shriver National Institute of Child Health and Human Development, the National Institutes of Health, the USDA Forest Service, the New Hampshire Agricultural Experiment Station, or the Carnegie Corporation. The authors thank Mimmo Parisi and Dan Lichter for their comments.