Key Findings


New Hampshire’s population grew by a modest 4.6 percent during the past decade to 1,377,500 in April 2020. In contrast, the number of minority residents, defined as those who were other than non-Hispanic Whites, increased by 74.4 percent to 176,900 in 2020. Minority residents now represent 12.8 percent of the state’s population compared to 7.5 percent (101,400) in 2010. Though the minority population grew, a substantial majority of the state’s population remains non-Hispanic White. In all, 87.2 percent of state residents (1,200,600) reported to the Census Bureau that they were White alone and not of Hispanic origin on the 2020 Census. This is 14,400 fewer than in 2010. New Hampshire’s population became more diverse because the minority population grew, while the non-Hispanic White population did not. Though racial-ethnic diversity is increasing in New Hampshire, it remains significantly less diverse than the nation, which is 42.2 percent minority. Only three states have a less diverse population than New Hampshire.
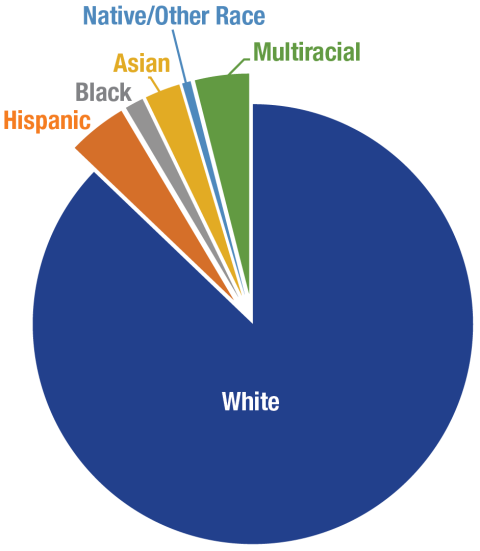
Hispanics are the largest minority population in New Hampshire with 59,500 residents, or 4.3 percent of the population (Figure 1). The non-Hispanic Asian population is 35,600 (2.6 percent), and non-Hispanic Blacks number 18,700 (1.4 percent). These groups each had significant population gains between 2010 and 2020. The largest population gain was among multiracial non-Hispanic residents, who at 54,600, now represent 4 percent of the state. The population reporting that they were Native American or of “some other race” also increased; together, these two groups now represent 0.6 percent of the state’s population.
Children in the Forefront of Growing Diversity
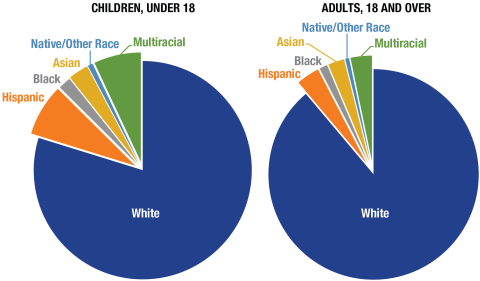
Children are at the leading edge of the state’s growing diversity. In all, 20.2 percent of New Hampshire’s under age 18 population belonged to a minority group in 2020, with Hispanics, Asians, and those of two or more races representing the largest shares (Figure 2). The greater diversity among children is the result of two diverging trends. The minority child population grew by 16,800 (47.9 percent) between 2010 and 2020.
Figure 1. New Hampshire Population by Race and Hispanic Origin, 2020

Note: “Native/Other Race” category includes individuals who report native origins as well as those who report “some other race.” Source: 2020 Census. Analysis: K.M. Johnson, Carsey School, University of New Hampshire.
Figure 2. New Hampshire Population by Age, Race, and Hispanic Origin, 2020

Note: “Native/Other Race” category includes individuals who report native origins as well as those who report “some other race.” Source: 2020 Census. Analysis: K.M. Johnson, Carsey School, University of New Hampshire.
In contrast, the non-Hispanic white child population declined by 47,200 (-18.7 percent). Because the minority youth gain was not sufficient to offset the non-Hispanic White loss, New Hampshire’s child population declined by 30,400 (10.6 percent). By comparison, the proportion of the adult population that is minority is considerably smaller than among children, at 11.1 percent in 2020.
Racial-ethnic diversity is geographically uneven in New Hampshire, with the most diverse populations concentrated in the Manchester–Nashua urban corridor, the Hanover–Lebanon region, and in a few areas on the Seacoast. This pattern is especially evident among children. For example, Manchester and Nashua are among the most diverse places in the state. The adult population in Manchester is 22.0 percent minority, and it is 25.9 percent minority in Nashua—both well above the state total of 11.1 percent. Among children, 43.1 percent of the children in Manchester and 45.4 percent of those in Nashua are minority.
New Hampshire’s growing racial-ethnic diversity, especially among those under age 18, means that youth centered institutions, such as schools and health care providers, have been the first to serve a diverse population. The growing diversity of the state’s youngest residents gives them a greater opportunity to grow up in multiracial and multiethnic communities that will enhance interracial relations, widen friendship networks, and prepare them for life in an increasingly diverse state and nation.
Methods and Data
Data are from the 2020 and 2010 Decennial Census. Race and Hispanic origin are defined separately in the Census and self-reported by respondents. In this paper, the population is divided into: Hispanic of any race; non-Hispanic White alone; non-Hispanic Black Alone; non-Hispanic Asian Alone; non-Hispanic Native Peoples or those of Some Other Race Alone; and non-Hispanic of Two or More Races (multiracial). Changes in Census Bureau procedures make it challenging to make direct comparisons between the racial categories in the 2010 Census and 2020 Census. Concerns about both the quality of the 2020 Census and the impact of the Census Bureau’s Differential Privacy algorithms on the accuracy of the 2020 Census remain unresolved at this time.
About the Author

Kenneth M. Johnson is senior demographer at the Carsey School of Public Policy, professor of sociology at the University of New Hampshire, and an Andrew Carnegie Fellow. His research was supported by the New Hampshire Agricultural Experiment Station in support of Hatch Multi-State Regional Project W-4001 through joint funding of the National Institute of Food and Agriculture, U.S. Department of Agriculture, under award number 1013434, and the state of New Hampshire. The opinions are his and not those of the sponsoring organizations. The research assistance of Kristine Bundschuh is gratefully acknowledged.