Key Findings


Kamala Harris’s choice of the Minnesota governor Tim Walz as her running mate revealed a battleground-state strategy: to do a bit better in rural America. “If you can do a couple points better, five points better, in those rural areas, and you multiply that by all the rural areas in those states, it’s a big deal,” said a Harris adviser (Siders 2024). Rural America’s 46 million inhabitants reside on 68 percent of the land area of the United States. They represented just 14 percent of the electorate in 2020, but their votes proved decisive in battleground states, where victory or defeat depended on a few thousands votes. In this brief, we estimate how much a slightly better (or worse) performance by the candidates in the rural areas of seven battleground states could influence the outcome of the 2024 election.
Voting Along the Rural-Urban Continuum
Here we focus on partisan polarization along the rural-urban continuum and on the significant decline in support of Democratic Presidential candidates in seven battleground states. Of particular interest is the performance of Democratic candidates in the four groups of counties at the rural end of the continuum. These range from rural counties just beyond the outer edge of metropolitan areas that contain a town of between 10,000 and 50,000 (Adjacent Large Town) to remote rural counties that neither adjoin a metropolitan area nor have a town of more than 10,000 (Not-Adjacent Other).
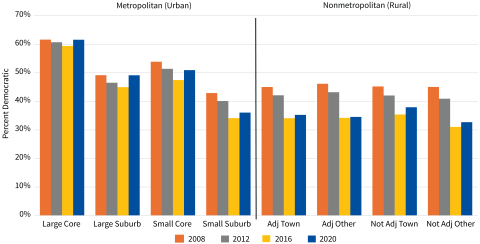
In 2008, Barack Obama received 45 percent of the votes in these four rural continuum categories in the seven battleground states (Figure 1). Though this was not a rural majority, it was enough to prevent his Republican opponents from tallying a large enough advantage in rural areas to offset Obama’s greater support in the heavily populated urban cores of metropolitan areas. This all changed in 2016, when Donald Trump far exceeded his predecessors’ performance in rural America, gaining nearly 66 percent of the rural vote in these battleground states. Four years later, Joe Biden modestly increased Democratic performance at the rural end of the continuum, though his support still lagged far below Obama’s. The modest increase in rural support contributed to Biden winning the White House by narrow margins in battleground states, but it did little to reduce the dependence of Democrats on the urban end of the continuum.

Data: Leip, 2020. Analysis: K. M. Johnson and D. J. Scala, Carsey School, University of New Hampshire.
2024 Rural Voting Scenarios: Small Changes, Major Impacts
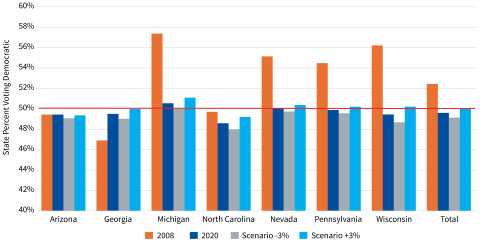
Rural voters are a modest share of all voters in the seven battleground states ranging from just 5 percent in Arizona to 26 percent in Wisconsin. How much would a small incremental change of plus or minus 3 percent in support in rural areas over 2020 levels influence the outcome of the 2024 election? Enough to make the difference between victory and defeat in several of the battleground states, according to our estimates, provided that other factors stay consistent with 2020 outcomes (see Methods section). Our scenarios examine the impact that a 3 percent incremental gain (far smaller than Obama’s margin) or a 3 percent loss of Democratic support in the rural areas of each state would have on the statewide election outcome. According to our scenario, a 3 percent increase in Democratic support in the rural counties of Michigan, Pennsylvania, and Wisconsin would push statewide support for Harris above 50 percent in each state, guaranteeing her victory (Figure 2). A similar improvement in rural Nevada would give Harris a majority in the Silver State, and a near-majority in Georgia. Conversely, in our scenario where Harris’s percent of the rural vote diminishes by 3 percent—regressing toward Clinton’s performance in 2016—success in Pennsylvania, Wisconsin, and Georgia becomes at best a remote possibility.
Thus, even though rural voters represent a modest share of all voters in these battleground states, small changes in the voting behavior of rural voters in 2024 could have major implications for the outcome of the election.

Data: Leip, 2020. Analysis: K. M. Johnson and D. J. Scala, Carsey School, University of New Hampshire.
Box 1: Defining the Rural–Urban Continuum
Metropolitan areas include counties containing an urban core with a population of 50,000 or more, and contiguous counties highly integrated with the core county. All other counties are classified as nonmetropolitan. To characterize the rural–urban continuum, we subdivided metropolitan and nonmetropolitan counties into eight categories:
- Large Core—67 counties that include the major city of a metropolitan area containing more than 1 million people in 2010. These counties include the major city and older suburbs.
- Large Suburb—365 noncore counties in metropolitan areas of 1 million or more. They encompass newer suburban areas and the periphery of large metropolitan areas.
- Small Core—339 metropolitan counties with the major city in a metropolitan area of less than 1 million. Most contain the central city and a large part of the suburban population.
- Small Suburb—392 noncore counties in metropolitan areas of less than 1 million. These counties contain suburban areas as well as the sparsely settled urban periphery.
- Adjacent Town—372 counties outside a metropolitan area but contiguous to one, that contained a town with a population of 10,000 to 49,999 in 2010.
- Adjacent Other—654 counties outside a metropolitan area but contiguous to one, that did not have a town with a population greater than 10,000 in 2010.
- Not Adjacent Town—269 counties that are neither metropolitan nor adjacent to a metropolitan area that contained a town with a population of 10,000 to 49,999 in 2010.
- Not Adjacent Other—657 counties that are neither metropolitan nor adjacent to a metropolitan area nor did they have a town with a population greater than 10,000 in 2010.
Methods and Data
The rural scenarios we develop based on our extensive research on presidential voting patterns along the rural-urban continuum from 2008 to 2020 estimate the impact of modest changes in rural voting for the 2024 election in the seven major battleground states that will likely determine the outcome of the election. The seven battleground states are Arizona, Georgia, Michigan, North Carolina, Nevada, Pennsylvania, and Wisconsin. The scenarios assume either a 3 percent increase or 3 percent decrease in support of the Democratic candidate compared to 2020 in each of the four rural continuum categories of counties in each state. The scenarios assume no change in total rural votes; total votes cast in each state; or the number or distribution of votes in metropolitan categories of the continuum. We recognize these assumptions are unlikely but employ them to isolate the impact of modest changes in rural voting. Counties are the units of analysis. There are 1,163 metropolitan (urban) counties and 1,949 nonmetropolitan (rural counties). We use the terms rural and nonmetropolitan interchangeably here, as we do the terms urban and metropolitan. To characterize the rural–urban continuum, we subdivided the counties into eight categories described in Box 1. The election data are from David Leip’s Atlas of U.S. Presidential Election.
About the Authors
- Dante J. Scala is professor of political science at the University of New Hampshire and a fellow at the Carsey School of Public Policy.
- Kenneth M. Johnson is senior demographer at the Carsey School of Public Policy, professor of sociology at the University of New Hampshire, and an Andrew Carnegie fellow.
Copyright 2024. Carsey School of Public Policy. These materials may be used for the purposes of research, teaching, and private study. For all other uses, contact the copyright holder.