Key Findings
(Revised November 17, 2020) To become the forty-sixth president of the United States, Joe Biden excelled at the margins. In swing state after swing state, he won small majorities that were just slightly larger than Trump’s winning percentages four years earlier,1 and he performed just a bit better than his predecessor, Hillary Clinton, particularly in large metropolitan areas where he received his strongest support. President Donald Trump’s greatest success occurred in the remote parts of rural America, though in 2020 his majority here was smaller than in 2016.
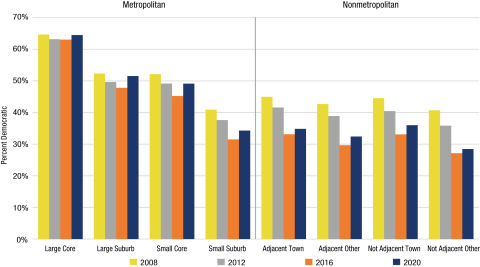
As political observers expected, Biden did best in the core counties of large metropolitan areas of 1 million or more (referred to here as “large core” metropolitan counties; see Box 1), where he received 64.5 percent of the vote (Figure 1).2 Democrats have consistently been most successful in these large urban core counties.3 Further along the continuum are the suburbs of these large metropolitan areas, then the smaller metropolitan areas of less than a million residents. Biden’s support was more modest in these places, but he still received a majority of votes (51.5 percent) in the suburban counties of large metropolitan areas and a near majority (49.1 percent) in the core counties of smaller metropolitan areas. Together, these three groups of counties produced 124 million (79.7 percent) of the 155 million votes cast so far. Biden received 55.4 percent of these votes, compared to Hillary Clinton’s 52.4 percent in 2016 and Barack Obama’s 54.3 percent in 2012.
Metropolitan areas include counties containing an urban core with a population of 50,000 or more (central city), along with adjacent counties that are highly integrated with the core county. All other counties are classified as nonmetropolitan. To characterize the rural–urban continuum, we subdivided metropolitan and nonmetropolitan counties into eight categories:
Metropolitan (Urban) Counties
- Large Core—67 counties that include the major city of a metropolitan area containing more than 1 million people in 2010. Most of the counties include both the major city and older suburbs.
- Large Suburb—365 noncore counties in metropolitan areas of 1 million or more. They encompass newer suburban areas and the periphery of large metropolitan areas.
- Small Core—339 metropolitan counties containing the major city in a metropolitan area of less than 1 million. Most contain both the central city and a large proportion of the suburban population.
- Small Suburb—392 noncore counties in metropolitan areas of less than 1 million. These counties tend to contain some suburban areas as well as the sparsely settled urban periphery.
Nonmetropolitan (Rural) Counties
- Adjacent Town—372 counties outside a metropolitan area but contiguous to one, that contained a town with a population of 10,000 to 49,999 in 2010.
- Adjacent Other—654 counties outside a metropolitan area but contiguous to one, that did not have a town with a population greater than 10,000 in 2010.
- Not Adjacent Town—269 counties that are neither metropolitan nor adjacent to a metropolitan area that contained a town with a population of 10,000 to 49,999 in 2010.
- Not Adjacent Other—657 counties that are neither metropolitan nor adjacent to a metropolitan area nor did they have a town with a population greater than 10,000 in 2010.
Source: Leip, 2020 as of 11/17/20. Analysis: K.M. Johnson, D.J. Scala, Carsey School, UNH.
Many commentators have pointed out Biden’s great success in the suburbs, such as Montgomery County outside of Philadelphia. As noted, Biden received the majority of the vote in the suburbs of large metropolitan areas, but the suburbs are hardly uniform in their political preferences. In 2020, Trump did well in the suburban counties of small metropolitan areas, just as he did in 2016. These “small suburb” counties have displayed voting patterns more similar to nonmetropolitan counties than to the other metropolitan counties in each of the past four elections. In both 2020 and 2016, Trump’s largest margins were in the four groups of nonmetropolitan counties we classify as rural. However, the magnitude of his support varied among these rural subgroups of counties and in 2020 it was consistently marginally less than in 2016. Trump did particularly well in the two groups of rural counties that did not include a large town of 10,000 to 50,000. For example, Democrats received just 28.5 percent of the vote in the most remote rural counties, i.e., those that were not adjacent to a metropolitan area and had no large town (“not adjacent other”). Trump also enjoyed strong support in the two groups of nonmetropolitan counties containing a large town. Even among those large-town counties adjacent to a metropolitan area, Biden received just 34.8 percent of the vote. Together, these five groups of counties—the suburban counties of small metropolitan areas and the four types of nonmetropolitan counties—cast 31.5 million votes, of which Biden received 33.7 percent, better than Clinton’s 31.4 percent in 2016 but considerably less than Obama’s 39.2 percent in 2012.
In sum, the 2020 presidential election results provided good news for Democrats, but they also reflected the same rural–urban continuum evident in the 2012 and 2016 elections. The language of political polarization often divides the United States into two opposing partisan zones—urban and rural. Yet our analysis demonstrates that rural America is not a monolith, nor is urban America. Rather, the rural–urban gradient is better represented by a continuum. At one pole are large, densely settled urban cores, where Democrats have consistently been the most successful. At the other end are remote rural counties far from a metropolitan area, without large towns, where Republican candidates command their greatest support. Along this entire continuum, Biden received a larger share of the vote in 2020 than Clinton had in 2016. Though the incremental gains at each point along the continuum were modest, in such a tightly contested election these small fractional changes in the vote were the difference between victory and defeat in 2020 just as in 2016. But make no mistake: Biden did not realign the political map, but he did manage to move the lines just a bit.
We examine voting along the rural–urban continuum using aggregate county voting data from the 2020, 2016, 2012, and 2008 presidential elections. We use counties as the unit of analysis, classifying each county as metropolitan or nonmetropolitan. Metropolitan areas include counties containing an urban core with a population of 50,000 or more (central city), along with adjacent counties that are highly integrated with the core county. There are 1,163 metro counties and 1,949 counties classified as nonmetropolitan. We use the terms rural and nonmetropolitan interchangeably here, as we do the terms urban and metropolitan. To characterize the rural–urban continuum, we subdivided the counties into eight categories that represent population concentration and proximity, from the densely settled large cities in metropolitan areas of a million or more to the most remote rural periphery (see Box 1). We obtained election data from Leip’s online atlas,4 though we did supplement the Leip data in two states. The data are current as of November 17, 2020. Minor data revisions are likely for some counties as official tallies are submitted. We are confident the overall trends reported here are correct, but our results should be considered preliminary until final data are released.
- Returns from the 2020 presidential election are still incomplete. Our data are current as of November 17, 2020.
- We use the terms rural and nonmetropolitan interchangeably here, as we do the terms urban and metropolitan.
- Dante J. Scala and Kenneth M. Johnson, “Political Polarization Along the Rural–Urban Continuum? The Geography of the Presidential Vote, 2000–2016,” Annals of the American Academy of Political and Social Science 672, no. 1 (2017): 162–84, https://journals.sagepub.com/doi/abs/10.1177/0002716217712696, and K.M. Johnson and D.J. Scala, “The Rural–Urban Continuum of Polarization: Understanding the Geography of the 2018 Midterms,” forthcoming in The Forum (2020).
- David Leip, “David Leip’s Atlas of American Elections,” 2020, https://uselectionatlas.org/.
Kenneth Johnson’s work was supported by his Andrew Carnegie fellowship. The opinions presented here are those of the authors and do not necessarily reflect the views of the funding organizations.
About the Authors

Kenneth M. Johnson (ken.johnson@unh.edu) is senior demographer at the Carsey School of Public Policy, Class of 1940 professor of sociology at the University of New Hampshire, and an Andrew Carnegie fellow.

Dante J. Scala (dante.scala@unh.edu) is professor of political science at the University of New Hampshire and a fellow at the Carsey School of Public Policy.