Key Findings
The week prior to the New Hampshire presidential primary is a time to remember the history of this quadrennial event in American politics. However, dwelling on the past could cloud our understanding of how the Granite State is evolving. The voters who flock to the polls on January 23 will include many new faces because the New Hampshire electorate has experienced significant turnover since the 2020 primary. In the past four years, the state gained 245,000 potential new voters, between newcomers moving to the state and young people reaching voting age. In the same period, 208,000 longtime residents left the state or died. As a result, 22 percent of potential Granite State voters next week were either too young to vote (6 percent) or did not reside in New Hampshire (16 percent) in 2020 (Figure 1).
The ideology and political party allegiances of these young people and new migrants differ significantly from those of longtime residents. In particular, both groups are more willing to take sides, rather than adhere to the political center. For instance, nearly 64 percent of the young potential voters are attracted to left-leaning ideologies, describing themselves as either liberal, progressive, or socialist (Figure 2). Regardless of their preferred ideological label, young voters are far more likely to identify as Democrats or Independents than as Republicans.
Figure 1. Young, Migrant and Established Potential Voters, 2024
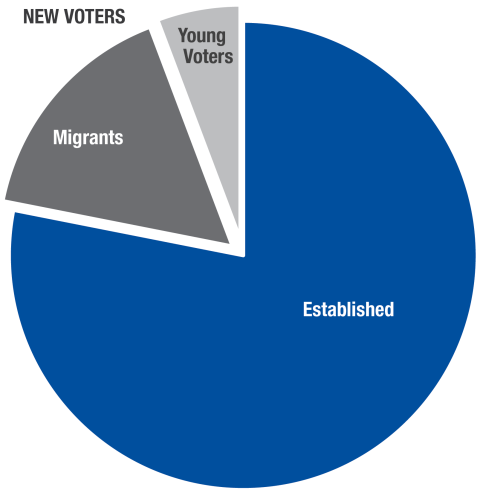
Note: Young voters reached voting age after 2019; migrants moved to New Hampshire after 2019. Source: U.S. Census Population Estimates and American Community Survey
Figure 2. Political Ideology of Young, Migrant, and Established Potential Voters
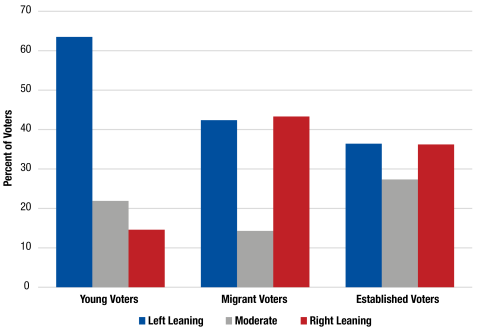
Source: 2023 Granite State Poll, University of New Hampshire
In contrast, newcomers are more evenly split between ideologies of the left and right, although Democrats enjoy a modest advantage among these recent migrants. Particularly important, however, is that relatively few describe themselves as moderates, especially as compared to established voters who make up 78 percent of the electorate.
The storied tradition of the New Hampshire primary includes a number of surprise finishes that have confounded campaigns and pundits. As we await the results next Tuesday, one factor that may increase volatility is the number of new voters who choose to participate for the very first time.
Methods and Data
Demographic data for this study come from the U.S. Census Bureau’s American Community Survey (2022 5-year estimates) and the 2023 Population Estimates. The Census Bureau uses the best data and algorithms available at the time of release to generate the data, but they remain estimates. Data on political ideology are derived from the Granite State Poll (GSP) collected in 2023. The GSP includes a panel of approximately 6,750 New Hampshire adults recruited from randomly selected landline and cellphone numbers to serve as panelists for online surveys; analysis here includes 3,688 respondents.
Political scientists traditionally have used a scale on which respondents place themselves from extremely liberal to extremely conservative. But in the modern political environment, these terms no longer capture people’s political ideology. Older left-leaning people are likely to identify as “liberal,” middle-aged people as “progressive,” and younger people as “socialist.” On the political right, many younger people prefer the term “libertarian,” while older voters describe themselves as “conservative.” Here we classify those identifying themselves as liberal, progressive, or socialist as left-leaning, and those who identify as conservative or libertarian as right-leaning. While the subsample size in the Granite State Poll for the young voters is small, these findings are consistent with other polls of the young (see the Harvard Youth Poll).
About the Authors
Kenneth M. Johnson is senior demographer at the Carsey School of Public Policy, professor of sociology at the University of New Hampshire, and an Andrew Carnegie fellow. Andrew Smith directs the Survey Center at the University of New Hampshire and is a professor of practice in political science at the University of New Hampshire. Dante J. Scala is professor of political science at the University of New Hampshire and a fellow at the Carsey School of Public Policy. The opinions are those of the authors and not those of the sponsoring organizations.