download the brief
Key Findings


The number of involuntary part-time workers, defined as those who would like full time work but for a variety of economic reasons cannot find it, rose sharply during the Great Recession and reached a peak of over 9 million in 2010.1 Although unemployment overall has returned to its pre-recession level, involuntary part-time employment is still much higher than it was before the recession began, a trend that raises questions about the continuing ability of the economy to deliver employment security to people willing and able to work (see Box 1 on page 2).
Involuntary part-timers include people like Salwa Shabazz, an African American woman who graduated from college in 2000 during an economic expansion. In an August 2016 opinion piece in the Philadelphia Inquirer, Shabazz described her experience with involuntary part-time employment:
I’ve worked on and off since 2008, but finding good work has become almost impossible. At one point, I was traveling two hours each way to get to my job at a state-run liquor store. I eventually had to quit when I suffered severe medical issues … A couple of years ago, I was able to work again and joined a job skills program. The program placed me at a job where I work part time—only 20 hours a week—as a cashier and food server at a university dining hall.…The unemployment rate apparently counts people like me as employed, even though I don’t work enough hours to pay my bills.2
Involuntary Part-Time Employment Remains Stubbornly High
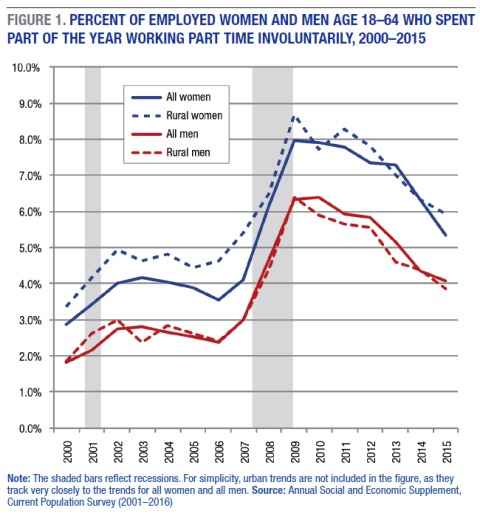
Figure 1 depicts the percent of women and men between the ages of 18 and 64 who spent part of the year between 2000 and 2015 working part time involuntarily. In 2006, before the recession, the involuntary part-time employment rate was 3.6 percent for women and 2.4 percent for men. It reached a peak of 8.0 percent for women in 2009 and a high of 6.4 percent for men in 2010. By 2015, when the unemployment rate had nearly recovered to its pre-recession level, the involuntary part-time employment rate was down only to 5.3 percent for women and 4.1 percent for men. Though it is down 34 percent since the recession, if the involuntary part-time employment rate were to continue this pace of decline, it would not return to its pre-recession level until 2018, a full nine years after the official end of the recession.
The trends for women and men are similar in rural and urban areas (see Box 2 for definitions of rural and urban). In 2006, before the recession, the involuntary part-time employment rate was 4.6 percent for women who lived in rural parts of the country (see Figure 1) and 3.4 percent for women who lived in urban areas. The rate reached a peak of 8.7 percent for rural women in 2009 and a high of 7.9 percent for urban women in 2010. By 2015, the involuntary part-time unemployment rate was down to 5.2 percent for urban women and 5.9 percent for rural women. The rate reached a peak of 6.4 percent for rural men in 2009 and a high of 6.5 percent for urban men in 2010. By 2015, the rate had declined to 4.1 percent for urban men and 3.8 percent for rural men.
Smaller Declines for Black Workers Than for White, Hispanic, and Asian Workers
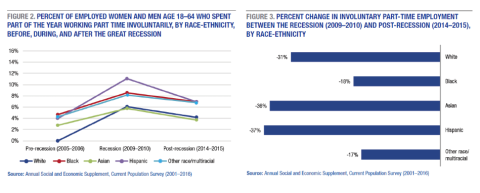
Some groups of workers have fared better than others. As Figures 2 and 3 show, since the recession, involuntary part-time employment declined by over 30 percent for white, Asian, and Hispanic workers but only by 13 percent for rural black workers and 19 percent for urban black workers. The rate declined by 20 percent for rural Asian workers compared to over 36 percent for urban Asian workers. Since most people live in urban places, the overall rates illustrated in Figures 2 and 3 are similar to the rates for urban workers.3
Other studies echo these results and point to racial disparities in the economic recovery. The unemployment rate for whites, for example, is at or below its pre-recession level in twenty U.S. states, but the level of unemployment for African Americans is at or below its pre-recession level in only nine states.4 Moreover, five of these nine states have unemployment rates that are among the highest in the nation.5 These racial disparities may correlate with racial residential segregation, as a recent study shows that unemployed African Americans are 60 percent more likely than other racial groups to live in areas with double-digit unemployment rates.6
Workers Without a High School Degree Are Much More Likely to Experience Involuntary Part-Time Work
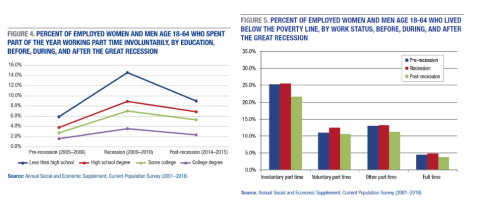
Educational disparities in involuntary part-time employment have persisted in the post-recession period in rural and urban areas. As Figure 4 shows, before the recession just 5.9 percent of those without a high school degree worked part time involuntarily. The figure peaked at 14.6 percent during the recession. Although those without a high school degree have fared relatively well during the economic recovery, they are still close to five times more likely to work part time involuntarily than those with a college degree.
More Than One in Five Involuntary Part-Time Workers Live in Poverty, Compared to One in Twenty-Five Full-Time Workers
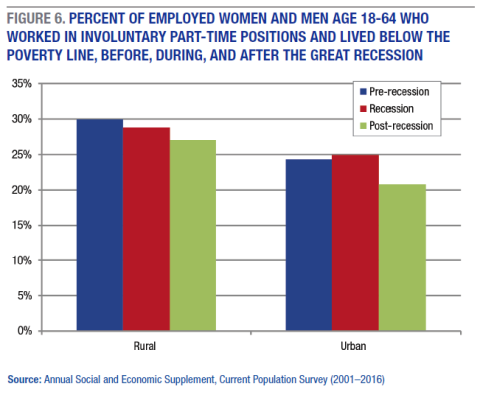
Involuntary part-time employment remains strongly correlated with poverty. As Figure 5 shows, in the pre- and post-recessionary periods over 20 percent of involuntary part-time workers, compared to about 4 percent of all full-time workers, lived below the federal poverty line. Thus today, involuntary part-time workers are more than five times as likely to live in poverty than are full-time workers. Figure 6 shows that the poverty rate is slightly higher for involuntary part-time workers residing in rural areas than in urban areas.
Involuntary Part-Time Workers Earn 19 Percent Less Than Full-Time Workers in Similar Jobs
Involuntary part-time workers earn 19 percent less per hour than those who work in similar jobs and have similar credentials.7 Women experience a 14 percent wage penalty for involuntary part-time employment, men 21 percent. These wage penalties are net of differences in workers’ occupations, industries, regional and metropolitan areas of residence, educational attainment, and age, meaning that, among men and women who are similar in all of these respects, the ones who work part time involuntarily will make 19 percent less per hour than the ones who work full time. The wage penalties remained relatively constant during the pre-recession, recession, and post-recession periods.
Summary
Although involuntary part-time employment declined by nearly 34 percent since the recent recession, it is still, unlike unemployment overall, higher than before the recession, and racial and educational disparities in involuntary part-time employment persist. Since the recession, involuntary part-time employment declined by over 30 percent for white, Asian, and Hispanic workers but by less than 20 percent for black workers. Among workers without a high school degree, 9 percent are working part-time involuntarily after the recession, compared to just 2 percent of college graduates. Involuntary part-time workers are more than five times as likely as full-time workers to live in poverty, and they earn 19 percent less per hour than full-time workers in similar jobs.
Some have asked whether this level of involuntary part-time employment is the new normal.8 Recent research suggests that the increase has been greatest in industries and occupations most affected by the Affordable Care Act (ACA), namely, in sectors with many previously uninsured workers.9 Other studies paint a more complicated picture by exploring movement into involuntary part-time positions from above and below—from full time down to involuntary part time, and from unemployment up to involuntary part time. During the recession, a significant share of involuntary part-time employment was attributable to the loss of work hours (that is, workers moving from a full-time schedule to a part-time schedule). In the post-recession, the largest share of involuntary part-time employment is attributable to the gain in work hours (that is, workers moving from unemployment to involuntary part-time employment).10 Perhaps today, involuntary part-time employment is a quick stop on the path toward full-time work. Or perhaps not. Another recent study shows that the percentage of those working part-time involuntarily because their employers cut their hours has returned to its pre-recession level, whereas the proportion of those working part time involuntarily because they cannot find full-time jobs has remained elevated.11 As the economy continues to recover, we need to explore the complexities of involuntary part-time employment and disparities in the recovery.
Data
This brief updates and extends past work on involuntary part-time employment. The analysis draws on data from the Current Population Survey (CPS), which is a monthly household survey conducted by the U.S. Bureau of Labor Statistics and the U.S. Census Bureau. The survey was initially designed in the 1940s to measure unemployment. Since then, it has been fielded every month to a sample of about 50,000 households. The CPS asks about part-time employment for the week before the survey and for the previous calendar year. Numerous studies have used both measures of part-time employment, and they tend to show similar results. This brief uses measures from the preceding calendar year. Unless otherwise noted, all differences are statistically significant (p<0.05). All data are weighted to account for the complex survey design. Industry is measured with 13 broad categories, and occupation is measured with 26 categories. All analyses exclude individuals living in group quarters and those under age 18 or over age 64.
Box 1. Defining Involuntary Part-Time Employment
The Current Population Survey includes two questions pertinent to this brief: (1) “Do you normally work a full-time or part-time schedule?” and (2) “What is the reason for your part-time employment?” From these two questions and following the Bureau of Labor Statistics, this brief defines an involuntary part-time worker as someone who normally works fewer than 35 hours per week because of poor economic conditions or an inability to find full-time work. This is contrasted with full-time workers, those who work part time by choice (voluntary part-time workers), and those who work part-time for other unspecified reasons.
Box 2. Defining Rural and Urban
Definitions of rural and urban vary among researchers and the sources of data they use. Data for this brief come from the Current Population Survey, which indicates if each household is located in a metropolitan area. The Office of Management and Budget defines a metropolitan area as: (1) a central county (or counties) containing at least one urbanized area with a population of at least 50,000 people, and (2) the counties that are socially and economically integrated with the urbanized area, as measured by commuting patterns. In this brief, urban refers to such metropolitan places, and rural refers to nonmetropolitan places outside these boundaries.
Endnotes
1. See U.S. Census Bureau, “Labor Force Statistics for the Current Population Survey,” http://data.bls.gov/timeseries/LNS12032194.
2. Salwa Shabazz, “Commentary: I Need the Economy to Give Me a Fair Chance,” Philly.com, August 18, 2016,http://www.philly.com/philly/opinion/commentary/20160819_Commentary__I_n....
3. The declines by race-ethnicity and by urban and rural are as follows: 30 percent for rural whites and 32 percent for urban whites; 20 percent for rural Asians and 36 percent for urban Asians; 51 percent for rural Hispanics and 36 percent for urban Hispanics; 13 percent for rural blacks and 19 percent for urban blacks.
4. Valerie Wilson, “State Unemployment Rates by Race and Ethnicity at the End of 2015 Show a Plodding Recovery” (Washington DC: Economic Policy Institute, 2016), http://www.epi.org/publication/state-unemployment-rates-by-race-and-ethn....
5. Ibid.
6. U.S. Department of Labor (DOL), “The African American Labor Force in the Recovery” (Washington DC: DOL, 2012), dol.gov/_sec/media/reports/blacklaborforce/.
7. Many other studies have shown that part-time jobs pay less than full-time jobs; for example, see Barry T. Hirsch, “Why Do Part-Time Workers Earn Less? The Role of Worker and Job Skill,” Industrial and Labor Relations Review, vol. 58 (2005): 525–51.
8. Rob Valletta and Catherine van der List, “Involuntary Part-Time Work: Here to Stay?” Economic Letters, Federal Reserve Bank of San Francisco, 2015; Patrick Gillespie, “America’s Part-Time Workforce Is Huge,” CNN Money, April 25, 2016, http://money.cnn.com/2016/04/25/news/economy/part-time-jobs/.
9. William E. Even and David A. Macpherson, “The Affordable Care Act and the Growth of Involuntary Part-Time Employment,” IZA Discussion Papers No. 9324 (Bonn, Germany: Institute for the Study of Labor, 2015).
10. Tomaz Cajner et al., “Why Is Involuntary Part-Time Work Elevated?” FEDS Notes, April 14, 2014.
11. Robert G. Valetta, Leila Bengali, and Catherine van der List, “Cyclical and Market Determinants of Involuntary Part-Time Employment” IZA Discussion Papers No. 9738 (Bonn, Germany: Institute for the Study of Labor, 2016).
Acknowledments
The author thanks Michele Dillon, Michael Ettlinger, Curt Grimm, Beth Mattingly, and Amy Sterndale of the Carsey School of Public Policy for comments and suggestions; Patrick Watson for editorial assistance; and Laurel Lloyd and Bianca Nicolosi at the Carsey School for layout assistance.