download the brief
Key Findings
There are 4 million more women aged 20–39 than in 2006, but 7 million fewer have given birth.
Had past fertility patterns been sustained, 5.7 million more women aged 20–39 would have given birth.
Shifts in childbearing and fertility patterns have resulted in 11.8 million fewer babies in the past 17 years.
In 2024, there were 44.2 million women aged 20–39 in the United States; 23.1 million (52 percent) have not yet given birth. Figure 1 shows that in 2024 there were 5.7 million more childless women of prime child-bearing age than would have been expected given fertility patterns prior to the Great Recession, up from 2.1 million in 2016 and 4.7 million in 2022. Had fertility patterns from just before the Great Recession continued, 4.4 million (25 percent) more women aged 20–39 would have had at least two children in 2024, and 1.3 million (15 percent) more women would have had a single child. Shifts in childbearing and in fertility patterns have resulted in 11.8 million fewer babies in the past 17 years. In 2024, there were 10 percent more women aged 20 to 39 than in 2006, but the share who had never had a child was up by 45 percent.1
The Impact of Social, Economic, and Epidemiological Factors on Fertility and Childbearing
A critical long-term question is: what impact has the economic, social, and epidemiological turbulence of the past 17 years had on fertility? Early expectations were that many births delayed by this turbulence would be “made up” as it faded. Yet 17 years after this turbulence began with the onset of the Great Recession, fertility rates remain near record lows, and the number of childless women continues to rise. In addition to the Great Recession and Covid, changing social, demographic, economic, and cultural factors also influenced attitudes about fertility, marriage, and children. These include greater educational and employment opportunities for women, the rapid increase in housing costs, the growing expense of children, limited access to child care and family leave, and changing patterns of cohabitation and immigration. Lower marriage rates account for much of the increase in childlessness, as fertility rates among never married women are lower than among woman who have been married. However, the number of married women who have not had a child is also higher than expected given historical trends.
Figure 1. More Women Aged 20 to 39, but Fewer Had Given Birth by 2024 Than Expected
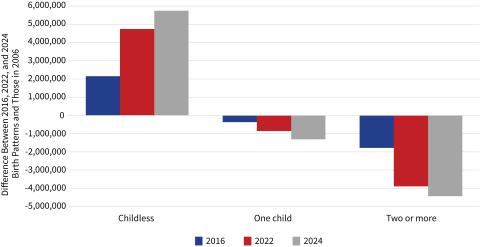
Source: Current Population Survey, U.S. Census. Analysis: K. M. Johnson, Carsey School, UNH.
The widely discussed “demographic cliff” reflects the cumulative impact of fewer women having children and diminishing fertility levels that has resulted in 11.8 million fewer U.S. births between 2007 and 2024 than if pre-recession fertility rates had been sustained.2 In 2024, there were 688,000 fewer births than in 2007—a 16 percent decrease—even though the number of women in their prime childbearing years (aged 20–39) was 10 percent higher. Fertility rate declines were greatest among women under 30, where childless rates increased the most. Childless rates increased modestly among women in their 30s, while fertility rates diminished minimally among women in their early 30s and increased modestly among women 35 to 49. However, the fertility gains among older women were too small to offset the significant fertility declines and increased childlessness among younger women.
The course of future childbearing and fertility remains to be seen. Certainly, some women who have delayed children may still have them, but the substantial rise in the proportion of childless women suggests that some will forego children. These fertility and child-bearing decisions have significant implications for health care, schools, child-related businesses, and eventually for the labor force.
Methods and Data
This analysis is based on data from the Census Bureau Current Population Survey from 2006 through 2024 and birth and fertility data from the National Center for Health Statistics.
Endnotes
- Women aged 20–39 accounted for 92 percent of all births in 2024. Natality Data 2024. National Center for Health Statistics, CDC. https://wonder.cdc.gov/natality.html
- Johnson, Kenneth M. 2025. “U.S. Births Up Slightly but Remain Near 40-Year Lows.” National Issue Brief 190 (Durham, NH: Carsey School of Public Policy, UNH, 2025).
About the Author
Kenneth M. Johnson is senior demographer at the Carsey School of Public Policy, professor of sociology at the University of New Hampshire, and an Andrew Carnegie Fellow. His research is supported by the NH Agricultural Experiment Station through joint funding from the USDA National Institute of Food and Agriculture (under Hatch-Multistate project W5001, award number 7003437) and the state of New Hampshire. The opinions are his and not those of the sponsoring organizations.
© 2025 University of New Hampshire. All rights reserved.