download the brief
Key Findings


The federal Earned Income Tax Credit (EITC) is one of the largest anti-poverty programs in the nation, offering tax credits to low- and moderate-earning families.1 The amount of EITC benefits varies by earnings and the number of dependent children in a family, with considerably more generous benefits going to families with children. In addition to the federal EITC, as of 2015, twenty-six states and the District of Columbia provided additional EITC dollars.2 Most state EITCs are generally structured such that they offer credits equal to a proportion of the federal EITC, varying from 3.5 percent in Louisiana to 40 percent in Washington, DC.
This brief documents the estimated effects of state EITC benefits on rates of poverty in 2010–2014 using the Current Population Survey (CPS) Annual Social and Economic Supplement (ASEC). First, we examine Supplemental Poverty Measure (SPM) rates and average EITC benefits across states with a fully refundable EITC between 2010 and 2014, and estimate how much higher poverty rates would have been in the absence of the state EITC. Next, we analyze how trends in poverty and state EITC benefits vary by race, marital status, metropolitan status, and region among these states. Finally, we project hypothetical differences in poverty rates for non-EITC states had they adopted EITCs of various generosities over this same time period.
It is important to note that we do not model behavioral changes that might result from the removal or addition of EITC benefits. Therefore, the analyses presented here are a simplified representation of such hypothetical scenarios. The SPM is an obvious choice for this analysis because, unlike the official poverty measure (OPM), which accounts only for before-tax cash income, the SPM also considers in-kind benefits, refundable tax credits, and out-of-pocket work and medical expenses when estimating resources.
Findings
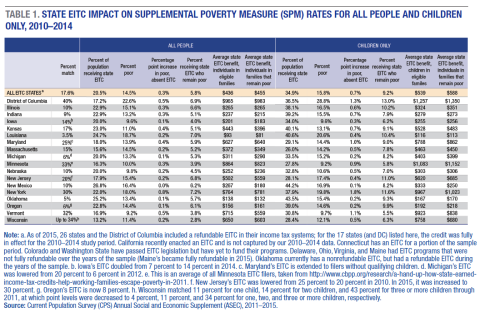
Table 1 presents the estimated effects of state EITC benefits on rates of poverty in states with a fully refundable EITC between 2010 to 2014. On average, individuals in EITC states receive a 17.6 percent match of their federal EITC benefit, and it pulls an estimated 0.3 percent of these states’ combined populations out of poverty. Children receive the greatest benefit, as state EITCs reduce child poverty by an estimated 0.7 percentage point overall, from 16.5 percent to 15.8 percent. Unsurprisingly, these estimated effects are even greater in more generous locales: EITC programs in Washington, DC; New York; and Vermont reduce child poverty by more than a full percentage point, or proportional reductions of 4.3 percent, 8.3 percent, and 10.2 percent, respectively, due to their EITC programs.
Even if families are not lifted out of poverty, state EITCs have a substantial impact: 43.2 percent of the poor in fully refundable states receive state EITC benefits3 at an average of $455 per family, which is roughly on par with the average state EITC refund in these states. Given the relatively low earnings of those who remain poor despite receiving EITC benefits, the practical impact of the benefit—which on average represents 2.4 percent of family earnings—is considerable. Research suggests that even small cash injections that state EITCs provide can have a meaningful effect for low-income families.4
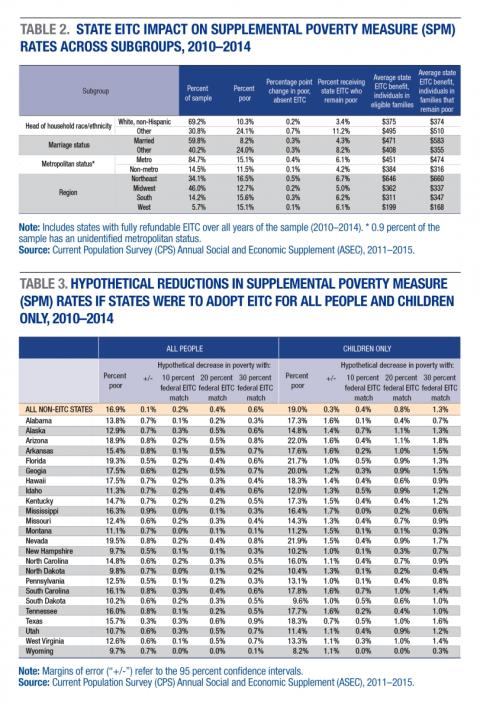
The impact of state EITC benefits varies by race, marital status, metropolitan status, and region (Table 2). For instance, the average state EITC benefit for non-white- or Hispanic-headed households is $495, lifting 0.7 percent of this population out of poverty. This contrasts with households headed by a white, non-Hispanic individual, which receive an average state EITC benefit of $375, lifting 0.2 percent of this group out of poverty. Although married families are much less likely to be poor than are non-married families, married families receive greater average ETIC benefits—which is not surprising given that the structure of EITC is more generous to married families than to single filers. Average EITC benefits vary across place, too: metropolitan families receive EITC benefits nearly a fifth larger than non-metropolitan families, and state EITC benefits in the Northeast are more than three times greater than those in the West.
States without an EITC program—which are more likely to be found in the South and West—tend to be poorer than states with their own EITC. If non-EITC states had comparable EITC programs in place, they would have experienced greater reductions in poverty than those estimated for EITC states. Table 3 illustrates hypothetical differences in poverty rates over 2010–2014 had states implemented EITCs at a rate of 10 percent, 20 percent, or 30 percent of the federal EITC; we use these levels because the majority of states with their own EITCs offer a percentage of the federal EITC within the 10 to 30 percent range. Similar to the previous analysis (in Table 1), state EITCs have roughly double the effect on absolute child poverty rates as they do on overall poverty rates. Additionally, effects vary across states. We estimate that Arizona, Arkansas, Georgia, Nevada, and Texas would all have experienced child poverty rates at least 1.5 percentage points lower in the case of a 30 percent match of the federal EITC. The greatest drop under such a scenario would have occurred in Arizona, where child poverty rates would have fallen from 22.0 percent to 20.2 percent—or by nearly a tenth.
Policy Discussion
In this brief, we document state reductions in poverty—both overall and for children specifically—in those places that have fully refundable EITC programs. Additionally, we perform analyses by population subgroups and also estimate the hypothetical reductions in poverty if states without an EITC adopted one. Although the federal EITC program is larger in scale than state EITC programs, the latter do have a measureable impact on poverty—especially child poverty. And for those families who receive state EITC benefits but remain poor, the EITC nonetheless supplies a meaningful portion of their total resources—nearly 2.4 percent of total family earnings on average.
Given the relatively low administrative costs associated with EITC programs when compared to other anti-poverty programs, as well as the fact that few states currently support generous EITC schemes, a substantial expansion in the scale and scope of current state EITC programs could have a significant impact on the circumstances of many low-income families in the United States. Moreover, the federal EITC is an important anti-poverty program because the assistance is post-tax and therefore does not generally impact eligibility for other safety-net programs. The state EITC programs analyzed here work roughly the same way in that they provide post-tax income for working families. This and other unique aspects of the EITC—requiring work, being offered as a once-a-year lump sum—mean that the EITC functions differently than other safety net programs. For instance, it can incentivize work among lower-income households,5 and EITC payments are often used in novel ways such as bill payment and debt reduction.6 In short, the EITC is an important complement to other anti-poverty programs.
Data
This brief uses data from the Current Population Survey (CPS) Annual Social and Economic Supplement (ASEC) from 2011 to 2015. The ASEC questions are asked throughout the year and released with the March data set. Questions about income refer to the previous calendar year, so results can be interpreted as the average over the 2010–2014 time period. Roughly 200,000 individuals are included each year, resulting in a final sample of 1,007,595 observations analyzed in this brief. The 2014 CPS ASEC utilized a probability split panel design to test a new set of income questions. Approximately three-eighths of the sample were randomly assigned to be eligible to receive the redesigned income questions, and the remaining five-eighths of the sample were eligible to receive the set of ASEC income questions that had been in use since 1994. We combined these two subsets to create a single, harmonized 2014 data set. We then used the redesigned income questions for the entire 2015 CPS ASEC sample. Although data are available for 2015, we did not use these more recent data because changing definitions of metropolitan and non-metropolitan status between 2015 and 2016 impede the analysis of metropolitan status from such a pooled data set.7
The CPS ASEC uses a tax model calculator to simulate tax income rather than tax information collected directly from respondents.8 Various state and federal taxes and credits, including the federal EITC, are simulated for each tax filing unit.9 We derive the state EITC benefit for each tax unit by using its imputed federal EITC and the value of its state’s EITC match in the previous year (as EITC refunds are made in the following year and thus affect poverty accordingly).10Because tax credits are simulated, it is possible that some families who receive the EITC may not be included and others who do not file/claim EITC or who are not eligible for EITC benefits (for example, undocumented immigrants) may be assigned a value due to errors in the tax model.
Endnotes
1. An earlier brief by the authors, which examined the impact of the federal EITC on poverty over these same years, can be found at https://carsey.unh.edu/publication/federal-eitc.
2. New York, NY, and Montgomery County, MD, have instituted additional working tax credits beyond those already offered within their states.
3. Of the poor in fully refundable EITC states, 43.2 percent received EITC benefits but remained poor, 23.5 percent belonged to families that worked but did not receive EITC benefits, while 33.4 percent did not work or have a working family member.
4. For instance, see Yannet M. Lathrop, “The Michigan EITC: A Small Investment That Makes a Big Difference” (Lansing, MI: Michigan League for Public Policy, 2013), and Caroline M. Sallee, “Economic Benefits of the Earned Income Tax Credit in Michigan” (East Lansing, MI: Anderson Economic Group, 2009).
5. See N. Eissa and H. Hoynes, “Redistribution and Tax Expenditures: The Earned Income Tax Credit,” National Tax Journal 64, no. 2 (2011): 689–729.
6. See R. Mendenhall et al., “The Role of Earned Income Tax Credit in the Budgets of Low-Income Families,” Social Service Review 86, no. 3 (2012): 367–400.
7. For more information, see http://www.cbpp.org/research/poverty-and-inequality/non-metro-areas-gain....
8. For more information, see census.gov/hhes/www/income/publications/oharataxmodel.pdf.
9. A tax filing unit may consist of an individual or a married couple who files a tax return jointly, along with dependents of that individual or married couple.
10. For instance, a tax unit with a $1,000 federal EITC in the state of New York (which has a 30 percent match) would have a $300 state EITC. A number of states changed the matching amount during the sample period, and this was accounted for.
Acknowledgements
This work was supported by the Annie E. Casey Foundation and anonymous donors. The authors thank Michael Ettlinger, Michele Dillon, Curt Grimm, Amy Sterndale, Laurel Lloyd, and Bianca Nicolosi at the Carsey School of Public Policy and Patrick Watson for editorial contributions.