download the brief
Key Findings


The U.S. drug overdose problem has reached epidemic levels, prompting President Trump to declare a public health emergency. Since 2000, 786,781 people in the United States have died from drug overdoses and other drug-related causes, with nearly 40 percent of those deaths occurring in the last three years alone.
The news media regularly portrays the drug overdose epidemic as a national crisis, but some places have much higher drug mortality rates than others. On average, rates are higher in counties with higher levels of economic distress and family dissolution, and they are lower in counties with a larger per capita presence of religious establishments. These findings hold even when controlling for demographic differences, urban or rural status, and health care supply.
The Geography of Drug Mortality
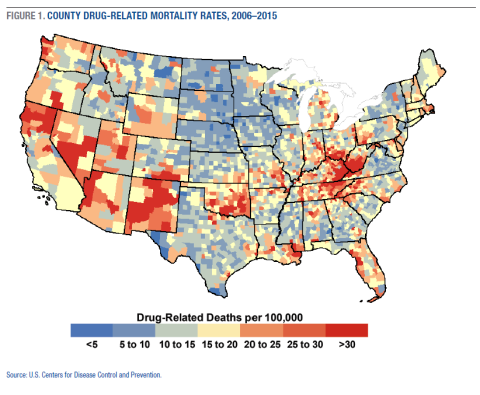
Of the 786,781 deaths from drug overdoses and other drug-related causes in the United States since 2000, opioids were involved in the largest proportion, but benzodiazepine and cocaine deaths have also increased in recent years.1 The economic, social, and emotional tolls of the drug epidemic are substantial, but some parts of the country are shouldering heavier burdens than others (Figure 1). For example, although the national drug-related mortality rate was 24.4 per 100,000 persons in 2016, it ranged from a low of 9.9 in Nebraska to a high of 60.3 in West Virginia. Rates in some counties in Indiana, Kentucky, New Mexico, and West Virginia ran well above 100.
The Role of Economic and Social Conditions in Drug Mortality
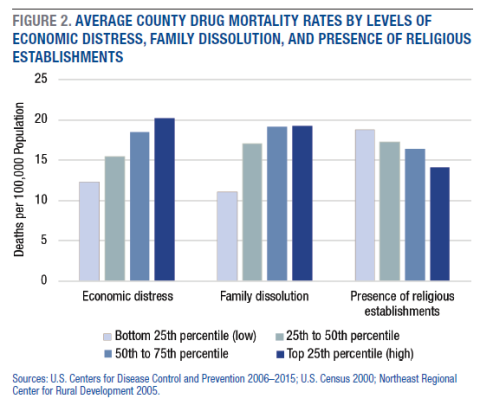
Economic distress is an important factor contributing to geographic differences in drug mortality rates. From 2006 to 2015, the average county drug mortality rate was 16.6 per 100,000 persons, but it was 12.3 in counties with the least economic distress (the lowest 25th percentile) and 20.2 in counties with the most (the highest 25th percentile). This difference of 7.9 deaths per 100,000 population is the equivalent of nearly 40,000 excess deaths over this 10-year period (Figure 2).2 The economic distress penalty remained even when controlling for a wide array of demographic and health care factors, including racial/ethnic and age composition, percent military veterans, metropolitan status, and designation as a primary-health or mental-health-professional shortage area.
Social factors are also related to drug mortality rates. Counties in the highest 25th percentile of divorce/separation and single-parent families had an average of 8.1 more drug-related deaths per 100,000 persons than counties in the bottom 25th percentile (Figure 2). Counties with the most (top 25th percentile) religious establishments (for example, churches and other places of worship) per capita had an average of 4.7 fewer drug-related deaths per 100,000 persons than counties with the lowest (bottom 25th percentile) presence of religious establishments. Findings were similar when looking at per capita religious affiliations rather than religious establishments.

There were no significant differences in mortality rates between rural and urban counties. However, some rural counties, especially those characterized by a labor market dependent on the mining industry, had very high drug mortality rates. Other rural counties, especially those with farming-dependent labor markets, had much lower drug mortality rates.
This brief does not attempt to explain why these specific economic and social conditions are related to drug mortality, but there are several possibilities. Economic insecurity contributes to family conflict and breakdown, hopelessness, and social disorganization, undermining important personal and institutional supports against depression and substance misuse.3 In mining communities in particular, significant industry declines have displaced workers and adversely impacted secondary service industries. Moreover, physically demanding and injury-prone jobs like mining place workers at risk for disability and chronic pain, increasing the likelihood of opioid use. The proliferation of illicit high-volume opioid clinics (that is, pill mills) and aggressive prescription opioid marketing throughout the 1990s and 2000s likely contributed to higher rates of drug deaths in these same places.4 However, the U.S. opioid problem has quickly transitioned from prescription opioids to heroin to fentanyl. Accordingly, policy efforts must consider both supply- and demand-side factors. The evidence from this analysis suggests that addressing economic and social conditions will be key to reversing the rising tide of drug deaths.
The drug epidemic is a pressing concern among policy makers. However, failure to consider the substantial geographic variation in drug-related mortality rates may lead to failure to target the hardest-hit areas. Social and economic environments are important targets for prevention because they affect stress, optimism and hope, health care investment, residents’ knowledge about and access to services, self-efficacy, social support, and opportunities for social interaction. Regarding the role of religious establishments and affiliations, opportunities for fellowship and civic engagement through religious and other organizations may facilitate social interaction, trust, and social cohesion and increase residents’ sense of belonging. Therefore, religious and other civic organizations may play an important role in marshaling social capital to fight the drug epidemic.

Data
County-level mortality data are from the U.S. Centers for Disease Control and Prevention (CDC) Multiple Cause of Death files, pooled for 2006–2015. Pooling years is necessary due to CDC suppression criteria, which mask death counts for counties with fewer than ten deaths. County demographic and economic data are from the 2000 U.S. Decennial Census and the 2010–2014 American Community Survey. Data on the presence of religious establishments are from the Northeast Center for Rural Development.5 Analyses were restricted to the forty-eight contiguous states and excluded Broomfield County, CO and Bedford City, VA, due to county boundary changes since 2000, and Loving County, TX, due to very small population size, resulting in a total of 3,106 counties.
The economic distress index comprised the following variables from the 2000 U.S. Census: percent poverty (age 25–54), percentage of households with supplemental security income, percentage of households with public assistance income, percentage of the civilian non-institutionalized population age 25–54 who were unemployed or not in the labor force, percentage of the civilian non-institutionalized population age 21–64 with a work disability, percentage of the population age 25+ with less than a four-year college degree, the gini coefficient of income inequality, and the percentage of the population age 18-64 without health insurance (measured in 2008). The family dissolution index included the following variables from the 2000 U.S. Census: percentage of the population age 15+ who were separated or divorced and the percentage of families with children headed by single parents. The religious establishment variable measured the number of religious establishments per capita in 2005.
Additional analyses considered economic distress and family dissolution measures from 2010–2014, and results were largely unchanged. Classification of drug-related deaths followed the International Classification of Disease Tenth Revision (ICD-10). Mortality rates are age adjusted and represent the number of deaths per 100,000 population. Full methodological details, including the specific ICD-10 codes identified as drug-related deaths, are presented in Monnat (2018).6
Endnotes
1. U.S. Centers for Disease Control and Prevention, National Center for Health Statistics, “Multiple Cause of Death 1999–2016,” https://wonder.cdc.gov/.
2. Excess deaths for counties in the highest quartile of economic distress were calculated as (1) the difference between the average age-adjusted mortality rates per 100,000 for counties in the highest and lowest quartiles of economic distress, (2) multiplied by the 10-year summed population of counties in the highest quartile of economic distress, (3) divided by 100,000.
3. A. Goldstein, Janesville: An American Story (New York, NY: Simon & Schuster, 2017); Carol Graham and Sergio Pinto, “Unequal Hopes and Lives in the U.S.: Optimism, Race, and Premature Mortality (Washington, DC: Brookings Institution, 2017), https://www.brookings.edu/research/unequal-hopes-and-lives-in-the-u-s/.
4 S. Quinones, Dreamland: The True Tale of America’s Opiate Epidemic (New York, NY: Bloomsbury Press, 2015).
5. A. Rupasingha, S.J. Goetz, and D. Freshwater, “County-Level Measure of Social Capital,” Northeast Regional Center for Rural Development, Pennsylvania State University, 2006, http://aese.psu.edu/nercrd/community/social-capital-resources.
6. Shannon M. Monnat, “Factors Associated With County-Level Differences in U.S. Drug-Related Mortality Rates,” American Journal of Preventive Medicine, OnlineFirst, 2018, ajpmonline.org/article/S0749-3797(18)30072-2/fulltext.
Acknowledgements
The author thanks Michael Ettlinger, Michele Dillon, Ken Johnson, Beth Mattingly, and Curt Grimm for helpful suggestions on earlier drafts. The author acknowledges funding from the U.S. Department of Agriculture Economic Research Service and the Institute for New Economic Thinking, as well as support from the W-4001 Committee, which is funded by the Western Association of Agricultural Experiment Station Directors (WAAESD). The views expressed in this brief represent those of the author and should not be attributed to these funding agencies.