download the brief
Key Findings


Although the Upper Valley has more than 200 licensed child care providers, the corresponding number of licensed slots is about 2,000 short of the estimated number of young children who likely need early care and education. Early childhood is a critical developmental period, and access to early childhood education is essential not only for learning but also as a necessary support for parents who work. While policymakers and practitioners recognize the importance and necessity of high-quality early education, its availability and affordability remain elusive for many families. The East Coast in particular has high child care costs, and child care consumes a large share of family income.1
Using data from the Census Bureau, state administrative systems, and a survey we conducted of working parents, this brief examines the child care landscape in one eastern region—the Upper Valley of New Hampshire and Vermont (see Box 1 for a description of the region and the “Data” section for details about the survey)—and links these findings to a discussion of early childhood education policy and practice.
Number of Young Children Likely Needing Care Outstrips Available Licensed Slots
As is the case across the United States, early childhood programming is a critical work support for a solid base of working families in the Upper Valley. Indeed, 96 percent of respondents in our Upper Valley Child Care Survey reported that child care is necessary in order for them to work. Census data indicate that there are about 9,700 children under age 5 in the Upper Valley, approximately two-thirds of whom—about 7,300—are in fully employed families (that is, two working parents if they live with two and one working parent if they live with one).2 Yet only 4,995 licensed slots are available for children in this age group. While it is unclear why child care slots are in such short supply, it is likely that challenges in maintaining staff in a difficult but low-paid profession, the challenges of adhering to strict state regulations, and the high costs of operating a facility in the expensive Northeast all play a role.
Figure 1 uses data from the Upper Valley survey to identify at least one way that working parents with at least one child under age 6 may be dealing with the dearth of licensed early education and care slots. Respondents who have at least one child under age 6 in child care,3 including infants (defined here as children up to 12 months of age), toddlers (12–35 months), and preschoolers (age 3 through 5 years), report using unlicensed care, or a mix of licensed and unlicensed care, at significant rates. Further, early education arrangements vary by the age of respondents’ children, with parents of infants being the least likely to use only licensed care (50.7 percent).

When asked to identify the most important factors in selecting an early education and care provider, one parent wrote, “This [question] assumes that there are choices. In the Upper Valley, you take what you can get. Number of available enrollment days is most important.”
The views of the parents surveyed further reinforce the inference that child care is in short supply. For example, 61 percent of respondents said their most recent experience enrolling a child in care was somewhat (40 percent) or extremely (21 percent) difficult, while just over a quarter said it was somewhat or extremely easy (19 and 8 percent, respectively). As Figure 2 shows, while one-fourth of respondents were able to enroll their child in their first choice of care,4 nearly half (47.1 percent) did so only after experiencing a waitlist, while another fourth failed to secure their first choice entirely.
Waitlists for child care slots in the Upper Valley are not brief: more than half of those who had experienced a waitlist reported a wait of more than three months. As noted by a survey respondent, some waitlists are never resolved, and responding to this challenge is difficult. Among those who didn’t end up with their first choice of child care, slightly fewer than one in ten reported taking leave from work or getting a different job; 76.3 percent reported simply settling for what they considered a worse option for child care.
When asked to identify the most important factors in selecting an early education and care provider, one parent wrote, “There is a lack of child care in the Upper Valley so availability is an issue for many. We were on waitlists and only heard back from one daycare, which is the one we go to. It was our #1 choice, but we didn’t have an option.”

Affordability of Care
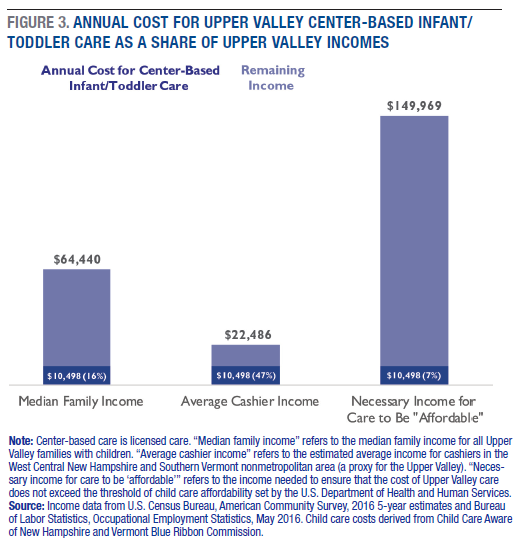
Data from Child Care Aware of New Hampshire and the Vermont Blue Ribbon Commission suggest that the estimated cost of full-time, year-round care for a child under age 2 is $10,498 and for a child age 3–5 $9,175.? As Figure 3 shows, with a median income of just over $64,000 among families with children, having a child under 2 in full-time care would consume about 16 percent of an Upper Valley family’s income (14 percent for a child age 3–5), more than twice the 7 percent the federal government considers affordable6 (see Figure 3). Among lower-earning families or single parents, this share would be significantly higher. For instance, for the Upper Valley’s estimated 5,600 cashiers7—selected as an example occupation in a region with a considerable retail workforce—an infant in care would consume nearly half (47 percent) of a worker’s typical income. Of course, affordability is measured on a family level and is not necessarily based on the earnings of a single worker, and families with especially low incomes may also be eligible for child care subsidies or sliding-scale fees. Nevertheless, the fact remains that for most Upper Valley workers, it is difficult to earn enough so that child care can be considered affordable. Further, for families with multiple children needing care, costs are magnified and consume higher shares of the family budget.
When asked to identify the most important factors in selecting an early education and care provider, one parent wrote, “Unfortunately, all other factors are secondary to being able to afford any child care.”
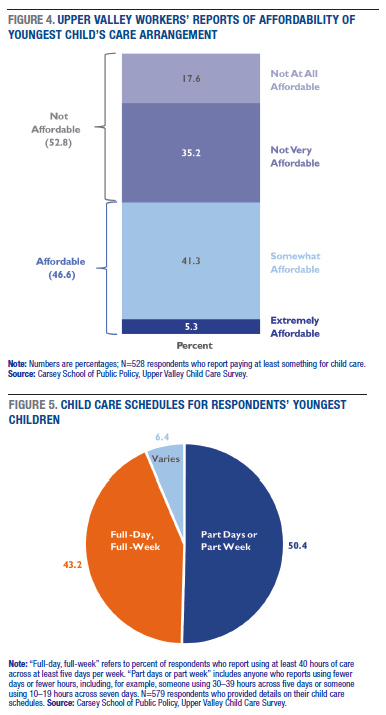
Given the findings shown in Figure 3, it is perhaps not surprising that Upper Valley parents who participated in the survey see the cost of care as burdensome (Figure 4). More than half (52.8 percent) said that care was not very or not at all affordable, while just 5.3 percent reported that their current arrangement was extremely affordable for their family. Additional analyses show that parents whose youngest child in care is a preschooler are more likely to report that care is affordable (52.0 percent) than are those whose youngest child is an infant (38.8 percent) or toddler (40.1 percent). These views are likely related to the age-based gradient in cost, wherein infant care is more expensive than care for older children as a result of the low child-to-staff ratios required for babies.
Flexible Child Care Options Are Key to Accommodating Varied Work Schedules
Along with variation in the type of care used (Figure 1), there is also significant variation in respondents’ care schedules. Figure 5 shows that half of respondents report that their youngest child in care attends less than full time, while another 43 percent report full-day, full-week attendance. Six percent report that their schedules vary. However, because respondents were asked to report their child’s attendance in ranges of hours (for example, 20–29 hours per week), it is possible that even those who didn’t explicitly say that their child’s schedule varies may indeed have some variation in attendance. While these arrangements may not always reflect ideal schedules for parents, it is clear that there is at least some demand for less than full-time care and education, alongside traditional full-time options.8
Understanding the kinds of jobs in which Upper Valley residents work reveals why varied child care options are important. For instance, Census data show that 11.6 percent of Upper Valley residents work in manufacturing (versus 10.3 percent nationwide), and that 11.2 percent work in retail (11.5 percent nationally). Data from the Bureau of Labor Statistics demonstrate that average weekly work hours vary by industry, with those in retail working about ten fewer hours weekly than those in manufacturing (31.0 versus 41.1 in April 2018),9 suggesting that child care needs might also vary between those groups of workers. Further, those in retail trade, and in sales in particular, are especially likely to work irregular hours, to have on-call schedules, and to work hours that vary week-to-week.10 These varied work hours and schedules most likely have implications for workers’ need for (and ability to afford) consistent child care week to week.
When asked to identify the most important factors in selecting an early education and care provider, one parent wrote, “[We] work in healthcare with very variable hours, inc[luding] early AM starts, [on] call [shifts], and weekends. This scheduling variability made finding a nanny very challenging and eliminated daycare as an option. In the limited pool of providers in the Upper Valley, this is a big issue. Our nanny’s flexibility is key.”
Further, those working odd hours may not have their needs met by child care providers that are open only during traditional business hours. More than half of all parents surveyed reported that there was a time in the last six months when they needed or wanted more child care but couldn’t get it. Of these workers, 59 percent said it was because more care would be too expensive, and 43 percent said that it wasn’t available on the days or hours in which they needed it (note that respondents could select multiple options; 36 percent did so). Taken together, these findings suggest that varied and flexible child care options may be key for meeting family needs.
Implications for Policy and Practice
The findings presented here indicate that working parents face challenges accessing early childhood care and education in the Upper Valley of New Hampshire and Vermont, as in other places nationwide. Finding enough quality, affordable care that matches family schedules is a persistent challenge for Upper Valley survey respondents, 55 percent of whom specifically express their need for more care than they can access or afford. When parents cannot access the kinds of child care they need, many must settle for less desirable options. Whether this means selecting care that is less convenient, less affordable, or of lower quality is unknown. However, given the role of early childhood in long-term developmental outcomes,11 providing options that are not only affordable and suit parents’ work schedules but that also deliver good quality curricula through warm interactions with consistent caregivers is especially important.
The Upper Valley’s child care challenges are not unique to that region. Although child care costs are higher on average on the East Coast than in other parts of the country, families in Southern states—where family incomes are lower on average—are also cost burdened at high rates.12 The nationwide lack of early childhood care and education slots, giving rise to what some call “child care deserts,”13 and the need for flexibility in meeting child care needs14 require multipronged strategies and policies.
For instance, in terms of policy, child care subsidies—available in every state and funded through state and federal dollars—can help defray the costs for certain low-income families. However, not all families are eligible, and research shows that most eligible families do not actually participate, perhaps due to lack of awareness, application burdens, or stigma.15 Still, expanding these options and working to better connect eligible families with subsidies may help ease the burden of cost on workers, although without additional early care and education slots, subsidies may not be helpful to all. Other federal policies include the March 2018 expansion of funds to support on-campus child care for low-income parents taking college classes16 and the federal Child and Dependent Care Credit.17
Outside of federal or state policy, industry leaders and early childhood professionals can also attempt to address existing child care and education challenges. For instance, employers could begin to recognize the role that access to early childhood care and education plays in shaping workforce participation and productivity18 and consider how to alleviate child care pressures on employees. These efforts may include expanding workplace policies that support flexible responses to child care and education gaps, such as paid leave, requiring standard scheduling (for example, consistency week-to-week, or no nights and weekends) for occupations that allow, and permitting nontraditional work scheduling, and telecommuting, in order to help parents respond more nimbly to child care challenges. Although the importance of early education has been clear for decades, younger workers’ expectations—especially demands for flexibility19—may begin to put pressure on employers to make these responses a reality. Finally, to support access to early childhood care and education, employers might also consider offering flexible spending accounts that can help employees cover child care costs with pre-tax dollars or offering on-site child care.20
At the practitioner level, state social service providers might more readily furnish families with information about subsidies and assistance with the enrollment and verification process. Finally, early childhood professionals may also consider expansions of flexible options like drop-in or back-up care, care options for sick children, and offerings during nontraditional hours. However, it is also important to recognize that child care providers are constrained in what they can offer and at what prices by the high costs of doing business, and the tight, albeit necessary, regulations around licensing.21 As a result, involving multiple stakeholders across industry—including business leaders, state social service workers, early childhood professionals, parents, educators, and philanthropists—is likely the most promising path to addressing child care issues in the Upper Valley and beyond.
Data
The data used in this brief are from a variety of sources, including the U.S. Census Bureau’s American Community Survey and Population Estimates (2016 5-year estimates), the States of New Hampshire and Vermont (for example, child care licensing data), the Bureau of Labor Statistics, and the Upper Valley Child Care Survey, which was conducted by the Carsey School of Public Policy and focuses on a select group of Upper Valley workers with children.
Invitations to participate in the Upper Valley Child Care Survey were extended to employees affiliated with four of the region’s largest employers (Dartmouth Hitchcock Medical Center, Dartmouth College, Hypertherm, and Alice Peck Day Memorial Hospital),22 with contact made by the Couch Family Foundation. All employees received an introductory email, drafted by the researcher, and a survey link from their human resources department, with a single reminder scheduled two weeks after the initial invitation. Data were collected between February 6, 2018, and March 15, 2018. It is not possible to calculate a response rate for this survey, as the share of employees who have young children is unknown. This survey does not represent a random or representative sample of Upper Valley workers or families. As such, its findings are not generalizable beyond the respondents. Results presented in this report are based on responses from 723 Upper Valley workers living with at least one child under age 6. Additional details about the survey are available from the author upon request.
The Upper Valley is defined broadly as a four-county region that includes Orange and Windsor Counties in Vermont and Grafton and Sullivan Counties in New Hampshire. Roughly bordered by the Green Mountains in Vermont and the White Mountains in New Hampshire, the region was home to an estimated 216,537 residents in 2017.
Box 1: The Upper Valley of New Hampshire and Vermont
The Upper Valley has a typically rural population distribution—that is, a relatively high median age and high levels of outmigration of young people—and, like the region as a whole, scores well on economic, social, labor force, and educational indicators. The generally high incomes and low poverty rates of the Upper Valley are fairly typical of the Northeast, and nearly 80 percent of the Upper Valley’s working-age adults are in the labor force; among women with young children the share is 72 percent. However, it is important to note that aggregate income and poverty statistics can mask areas of higher poverty within the region, and, as is true nationwide, the Upper Valley’s children have higher poverty rates than the Upper Valley’s population overall (15.1 versus 11.2 percent).
Endnotes
1. Marybeth J. Mattingly, Andrew Schaefer, and Jessica A. Carson, “Child Care Costs Exceed 10 Percent of Family Income for One in Four Families,” Issue Brief No. 109 (Durham, NH: Carsey School of Public Policy, 2016), https://carsey.unh.edu/publication/child-care-costs.
2. It is important to note that there is considerable imprecision associated with the working parents statistic; specifically, the estimated share is around 65 percent but the margin of error is +/-5.5 percentage points, translating to a range of 59.4 to 70.5 percent.
3. In all analyses of the Upper Valley Child Care Survey in this brief, respondents are included if they report using at least five hours of nonparental child care per week.
4. The Upper Valley Child Care Survey asked participants about how they heard about their child care provider, and what factors mattered most in selecting a provider. Overwhelmingly, the role of informal resources emerged as particularly salient for this group: 50.4 percent of participants said they’d heard of their current provider from a relative, friend, or family member (versus, for example, 2.2 percent who had learned of their provider from a state agency). Further, having heard good things about a provider from someone they know was especially important in selecting a provider: it was ranked as the most important factor by more than one-third of respondents and had the lowest share of respondents ranking it as the least important factor. Having state credentials, on the other hand, was of mixed importance to participants: one quarter of respondents ranked it as their most important factor and another quarter ranked it as their least important factor.
5. Data on Upper Valley child care costs should be considered an estimate because, while the New Hampshire Child Care Resource and Referral Network (CCR&RN) furnished county-specific cost data upon request, the state of Vermont (which has no CCR&RN) has not done so to date. As such, the data used to calculate costs on the Vermont side of the border are derived from an existing report, with no opportunity to independently verify the figures for accuracy. However, given those values’ similarity to the confirmed values in New Hampshire, it seems likely that they are accurate. As presented here, data for the Vermont side of the Upper Valley are derived from the Vermont Blue Ribbon Commission report, from Appendix 1, Table 4 (http://buildingbrightfutures.org/blue-ribbon-commission/). I assume that the data listed in this report refer to full-time, year-round care and that “infant” and “preschool” are defined using the same definitions as the Vermont 2015 Market Rates Survey, cited within.
6. See the proposed rule by the Health and Human Services Department establishing this benchmark of affordability at https://www.federalregister.gov/documents/2015/12/24/2015-31883/child-ca....
7. Bureau of Labor Statistics, Occupational Employment Statistics, May 2016 Metropolitan and Nonmetropolitan Area Occupational Employment and Wage Estimates. Note that for this data source the “Upper Valley” is a geographic approximation, comprising two proxy geographies: the West Central New Hampshire nonmetropolitan area and the Southern Vermont nonmetropolitan area. These areas roughly coincide with the Upper Valley but exceed its boundaries; a map of this geography is available from the author upon request.
8. Importantly, the 579 respondents who reported their youngest child’s care schedule did so with 37 different combinations of hours and days per week attended. This tremendous variability in care scheduling supports the interpretation that parents may need flexible and varied options to meet their care needs.
9. U.S. Department of Labor, Bureau of Labor Statistics, Economic News Release, Table B-2, May 4, 2018, https://www.bls.gov/news.release/empsit.t18.htm.
10. Lonnie Golden, “Irregular Work Scheduling and Its Consequences,” EPI Briefing Paper #394 (Washington, DC: Economic Policy Institute, 2015), http://www.epi.org/publication/irregular-work-scheduling-and-its-consequ...).
11. “Brain Architecture,” Center on the Developing Child, Harvard University, https://developingchild.harvard.edu/science/key-concepts/brain-architect....
12. Mattingly, Schaefer, and Carson (2016).
13. Rasheed Malik, Katie Hamm, Maryam Adamu, and Taryn Morrissey, “Child Care Deserts: An Analysis of Child Care Centers by ZIP Code in 8 States” (Washington, DC: Center for American Progress, 2016), https://www.americanprogress.org/issues/early-childhood/reports/2016/10/....
14. Arthur C. Ehmlen, “Solving the Childcare and Flexibility Puzzle: How Working Parents Make the Best Feasible Choices and What That Means for Public Policy,” Paper #40 (Portland, OR: Regional Research Institute for Human Services Publications, 2010).
15. Nicole Forry, Paula Daneri, and Grace Howarth, “Child Care Subsidy Literature Review,” OPRE Brief 2013-60 (Washington, DC: Office of Planning, Research, and Evaluation, Administration for Children and Families, U.S. Department of Health and Human Services, 2013).
16. Farran Powell, “What to Know About Child Care Access in College: On-Campus Child Care Can Help Student Parents Manage College Costs,” U.S. New & World Report, May 16, 2018, https://www.usnews.com/education/best-colleges/paying-for-college/articl....
17. “Ten Things to Know About the Child and Dependent Care Credit,” Internal Revenue Service, https://www.irs.gov/newsroom/ten-things-to-know-about-the-child-and-depe....
18. Child Care Aware, “Parents and the High Cost of Child Care” (Arlington, VA: Child Care Aware, 2017).
19. Tess C. Taylor, ”Workplace Flexibility for Millennials: Appealing to a Valuable New Generation,” Forbes, December 7, 2017, https://www.forbes.com/sites/adp/2017/12/07/workplace-flexibility-for-mi....
20. Julia Beck, “How Some Companies Are Making Child Care Less Stressful for Their Employees,” Harvard Business Review, 2017, https://hbr.org/2017/04/how-some-companies-are-making-child-care-less-st....
21. For more detail on what drives child care costs, see the interactive tool www.costofchildcare.org, published by the Center for American Progress.
22. Additional large area employers were also invited to participate in this project but declined to do so. These employers included Sturm Ruger Firearms, Whelen Engineering, Plymouth State University, and Timken Aerospace. These four and the four participating employers are the region’s largest employers.
Acknowledgements
The author thanks Michael Ettlinger, Curt Grimm, Michele Dillon, and Beth Mattingly of the Carsey School of Public Policy for comments on an earlier draft; Patrick Watson for his editorial assistance; and Laurel Lloyd and Bianca Nicolosi at the Carsey School for their layout assistance. Additional thanks to Michael Bennett and Jessica Ratey of Mott Philanthropic for comments on an earlier draft.
This brief would not be possible without the assistance of data stewards in various offices of the States of New Hampshire and Vermont, the dissemination efforts of human resources departments of employers participating in the survey, and the generosity of Upper Valley workers themselves who took time to participate in this research; the author is grateful to all.
This research was commissioned by the Couch Family Foundation to inform its early childhood strategy in the Upper Valley. For more information about the foundation, please visit: www.couchfoundation.org.