download the brief
Key Findings



May 2017 update
PointLogic Energy, a source for natural gas pipeline flow and capacity in the original report, has recently updated its models for calculating natural gas flow in the Tennessee Gas Pipeline in New England. This model update has resulted in significant changes to their previous estimates. Most importantly, data obtained from PointLogic Energy in December 2016 supported the finding that overall net gas flow in the “Tennessee Gas Pipeline: NY to MA” was from Massachusetts to New York from 2013–2016; their revised models indicate a net flow during the same period from New York to Massachusetts. To be conservative, we have removed analysis of natural gas pipeline flow and capacity from this report that relied on the original data obtained from PointLogic Energy. Instead, we use estimates of natural gas pipeline flow and capacity published in a 2014 ICF International report that was commissioned by ISO New England (Exhibit 2-3, pp. 12)a and information provided by the U.S. Energy Information Administration.b
a ICF International, “Assessment of New England’s Natural Gas Pipeline Capacity to Satisfy Short and Near-Term Electric Generation Needs: Phase II,” 2014 .
b U.S. Energy Information Administration,
“U.S. State-to-State Capacity,” updated 12/31/2015; U.S. Energy Information Administration, “New England Natural Gas Pipeline Capacity Increases for the First Time Since 2010,” December 6, 2016 (see endnote 15).
Download the revised publication.
Download the previous version of this publication.
Introduction
Over the past decade a number of factors have transformed global and national energy markets. Access to low-cost natural gas has been a significant part of this trend. Nationally, natural gas-fired power generation was expected to have exceeded coal-fired power generation for the first time in 2016,1 and in New England about 50 percent of electricity is now generated from natural gas.2 With natural gas now such a large part of New England’s energy mix, there is a concern that the demand for heating and electricity during cold periods will cause spikes in wholesale electricity prices and that demand may be greater than the available pipeline capacity to deliver natural gas.3 The region’s utility industry has proposed the expansion of pipeline capacity to meet this seasonal increase in the demand for natural gas.
In light of the trends influencing energy markets, this perspectives brief and a related report4 examine the cost of electrical power in New Hampshire and New England, the reliability of the electrical power system in terms of its ability to meet demand, and the risk New Hampshire ratepayers might face from various proposals to secure or increase the supply of electricity. We find evidence that near-term levels of demand and supply pose no threat to grid reliability, that current pipeline capacity is adequate, and that better contracting practices and other “soft-infrastructure” changes combined with the promotion of energy efficiency and renewable energy will have at least as large a return on investment as expanded pipeline capacity, without exposing ratepayers to higher electricity rates stemming from expensive infrastructure investments.
Cost of Electrical Power in New Hampshire
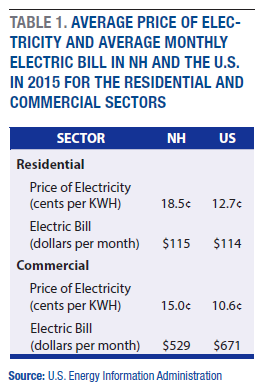
In 2015, electricity accounted for approximately 25 percent ($1.7 billion) of all energy expenditures in New Hampshire,5 and average retail electricity prices in the state, at 18.5 cents per kilowatt hour, were the eighth highest in the country and 47 percent higher than the U.S. average (Table 1). The latter is also the case for New England as a whole. But despite these higher rates, the average monthly New Hampshire residential electricity bill was $115, similar to the U.S. monthly average of $114.6 New Hampshire residents pay 5.5 percent of their income for overall household energy-related expenses, similar to the overall U.S. resident portion of expenditures at 5.6 percent. In terms of commercial use, the average monthly New Hampshire electric utility bill in 2015 was actually lower than the U.S. average commercial bill,
at $529 versus $671.7
The relatively higher price of electricity in New Hampshire and New England is a result of several factors,8 including higher transmission and distribution costs that have resulted from a large number of new transmission projects (over 600 across New England since 20029), wholesale market rules, higher air quality standards, historical investment decisions (and the stranded costs associated with some of those investments), and the lack of indigenous fossil fuel sources that place the region at the “end of the pipeline” for the transport of fossil fuels.
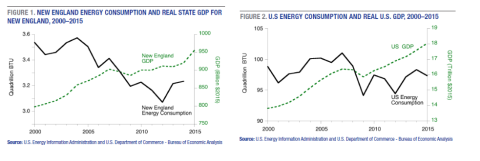
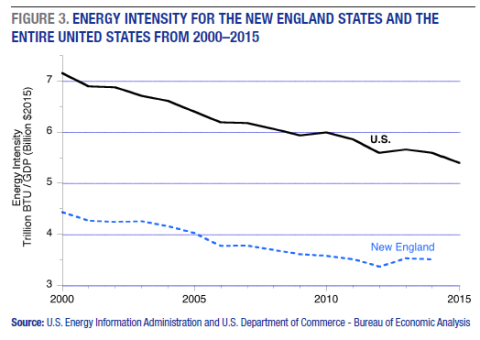
New England has adapted to higher prices through energy efficiency and other energy management investments.10 Even as the combined gross domestic product (GDP) for all six New England states increased by 9.7 percent from 2005 to 2015, overall energy use declined by 9.6 percent (Figure 1). During the same period, the U.S. GDP grew 15.2 percent while energy consumption fell 3.4 percent (Figure 2). Energy intensity (energy use divided by GDP) in New England is much lower than the U.S. average (Figure 3), demonstrating that New England consumes much less energy per dollar of GDP. In addition, over the past decade, New England’s energy intensity has improved by 12.7 percent.
Though New Hampshire residents and businesses pay the same or less for energy as other areas of the country, it is important to prevent further increases in the cost of energy and ideally to reduce the overall cost of electricity in New Hampshire. This is especially true for customer groups adversely affected by New Hampshire’s relatively high electricity prices, including more intensive commercial and industrial users of electricity, as well as low-income households who pay a greater portion of their income for energy.
Reliability of the Electrical Supply
In New England, the share of electrical power generated from natural gas has grown from 15 percent in 2000 to almost 50 percent in 2015.11 The region’s electric utility industry has expressed concern that the demand for electricity during periods of cold winter weather will be greater than current pipeline capacity to deliver natural gas, resulting in unreasonably high electricity prices and possible power grid instability. ISO New England, the organization responsible for coordinating the region’s power grid, has called for new natural gas infrastructure investment.12
Several studies conducted between 2012 and 2015 have examined the reliability of the New England power grid, and none of the eight reviewed for this study found that grid reliability is an immediate risk to New England’s energy security.13 Furthermore, while some studies have suggested that grid reliability may be an issue after 2021, the potential challenges are primarily associated with extreme operating conditions. The region’s power grid system operator has demonstrated success in managing these extreme conditions and has been proactive in adapting the rules and procedures under which power generators operate to further increase grid reliability.
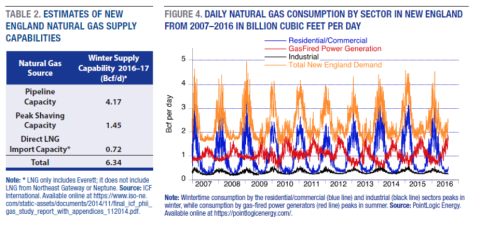
Several lines of evidence support the conclusion that few if any electrical grid reliability problems are likely to emerge before 2021. First, an ICF International report14 estimates natural gas pipeline capacity in New England at 4.17 billion cubic feet per day (Bcf/d) (Table 2). This, combined with peak shaving capacity (1.45 Bcf/d) and direct LNG import capacity (0.72 Bcf/d), estimates an overall supply capacity of natural gas of 6.34 Bcf/d in winter. This capacity value exceeds recent New England peak winter demand (compare Table 2 values to the peak demand of under 5 Bcf/d illustrated in Figure 4). A separate indicator of pipeline capacity is the sum of state inflow capacities obtained from the U.S. Energy Information Administration (U.S. EIA) for natural gas pipelines in New England of 4.96 Bcf/d.15 This represents an estimate of the total pipeline capacity that exists in New England. However, some pipeline in-flow capacity may not be fully available due to technical capacity constraints within the New England natural gas system.16 The difference between the state in-flow pipeline capacity and the estimates of pipeline capacity obtained from the ICF study17 raises the possibility that pipeline capacity may be underutilized and/or that changes in New England internal gas pipeline infrastructure might allow for greater utilization of existing in-flow pipeline infrastructure.
Second, “soft infrastructure” changes (changes to rules, regulations, or policies such as the Winter Reliability Program) can serve as an effective tool for mitigating spikes in wholesale prices. For example, New England electric utilities that purchase gas to generate electricity typically do not contract for firm transportation services18 to obtain natural gas; instead, they take what is left over. This is a major deliverability challenge and diminishes supply reliability. Specifically, power generators that rely on natural gas to generate electricity do not find it profitable to contract for access to gas under the current New England power system rules because firm gas transportation arrangements are structured as “take-or-pay” contracts.19 Under these contracts, generators are required to pay for transportation capacity whether or not they are operating, and therefore contracts are not desirable. During most days of the year, generators are able to access gas and use transportation that would otherwise be surplus at far lower cost than contracting for firm transportation. While this contracting structure works for most of the year, during days of high demand it can result in periods when most of the gas is being used by sources who have gas contracts (including natural gas utilities supplying their residential customers and large industrial users). While such scarcity can result in price spikes for natural gas and electricity when demand increases rapidly due to very cold periods or when other major electricity generation stations (such as nuclear power plants) go off-line, they do not appear to impact system reliability. For example, during the high demand for natural gas and related price spikes that occurred in January 2014 associated with the outbreak of the Polar Vortex, not only did the ISO New England power grid provide sufficient electricity to New England consumers during this time period, ISO New England actually assisted the PJM (Mid-Atlantic) energy marketplace by dispatching additional generation units in New England.20
Third, electricity consumption in New England is expected to decline by 0.2 percent per year over the next decade.21 Even with this projected decline, concerns have been raised about the supply impact of the 2014 retirement of the Vermont Yankee nuclear power plant and the proposed retirement of Pilgrim Nuclear Power in Massachusetts in 2019, as well as the possible closure of several coal- and oil-fired generating plants.22 Requests from companies to connect electric generation assets to the grid (interconnection requests) are, however, plentiful. Between 2016 and 2020, more than 11,000 megawatts of capacity (35 percent of total existing generating capacity of 31,000 megawatts23 ) have been proposed, and these don’t even include plans for transmission lines to import hydroelectric energy from Canada, discussed below. Almost 60 percent of proposed generation is natural gas or dual fuel (natural gas and oil) and about 35 percent is wind, mostly in Maine. While not all projects will necessarily be constructed, the interconnection requests provide a useful indicator that there is a considerable amount of new electrical power production slated to come online in the near future. One report suggests that, from a reliability perspective, the current buildout plan—evidenced by the interconnection requests—is sufficient over the short term.24
Plans to build new transmission lines to import hydropower from Quebec into New England include the Northern Pass25 project, designed to bring 1,090 megawatts through New Hampshire, and the 1,000 megawatt New England Clean Power Link26 transmission line underneath Lake Champlain and into Vermont. This range of new supply could provide diversity in the source of energy used to power New England’s grid, an important hedge in light of rapidly changing global energy markets. There has been insufficient study assessing the energy security risk of increasing New England’s dependence on natural gas sourced primarily from one geographic region (Marcellus Shale from the Appalachian Basin). Yet, the natural gas export capacity from that region to other regions of the United States and globally is expanding significantly.27
Risks to the Grid and to Ratepayers
The difference between the sum of state in-flow capacity obtained from the U.S. EIA and the estimated available capacity assumed in the ICF study may be evidence of some of the potential risks associated with pipeline investments including that changes in supply and/or demand can result in underutilized pipeline. Demand can end up not matching supply when the pipelines are built, leaving stranded costs that the customer ends up having to pay. (Stranded costs are ones that must be paid by utility ratepayers if infrastructure investments become redundant either through market forces or regulation.) Given the long-term cost recovery period of infrastructure, a poorly informed decision can have a long-term impact on electricity rates.
Previous utility proposals have requested that New Hampshire electric ratepayers fund the costs associated with new natural gas pipelines. But the finding that near-term energy supply is not a threat to power grid stability28 provides New Hampshire policy makers time (that is, years) to fully consider the costs, benefits, and risks associated with increasing New Hampshire’s reliance on one fuel source from one geographic region.
Proceeding carefully and deliberately seems particularly important if the taxpayer (and not private capital) will be funding the new infrastructure. An example supporting a careful approach is the investment in 2012 of $409 million in new pollution control equipment at the Merrimack Station coal-fired power generation plant in Bow, New Hampshire. Due to changing market conditions, the plant is now valued at just $10 million. New Hampshire ratepayers are paying for all but $25 million of the $409 million through a cost recovery mechanism on electricity bills.29 This single investment30 will add 0.4 cents per kilowatt-hour (or about 2.5 to 3.0 percent) to every New Hampshire electric ratepayer’s bill for many years to come. If new natural gas capacity results in overbuild, and ratepayers are contractually obligated for the costs, the cost of unneeded capacity will reduce the savings estimated to accrue to electric ratepayers.
Responses from an October 2016 Granite State Poll31 show that a large swath of New Hampshire residents—58 percent—oppose using ratepayer funds for new pipeline infrastructure. This view was shared by almost half of self-described politically conservative respondents (48 percent) and six in ten liberals (63 percent) and moderates (60 percent).
Historically, New Hampshire has lagged behind the New England region in renewable energy and energy efficiency investment. For example, in 2015 New Hampshire had both the lowest total ($26 million) and per capita ($19.20) public spending on electric efficiency programs out of the New England states. New Hampshire’s per capita expenditure on energy efficiency programs was almost 80 percent less than that of Vermont.32 However, New Hampshire has made progress in supporting clean energy investment with its participation in the Regional Greenhouse Gas Initiative (enacted in 2008), the Renewable Portfolio Standard (2007), and the recently approved Energy Efficiency Resource Standard (EERS) (August 2016). The New Hampshire EERS takes effect in January 2018 and has established a cumulative goal of 3.1 percent electric savings relative to 2014 kilowatt-hour sales. States that have implemented EERS have experienced three times the energy savings as states without an EERS.33 This is an example of the type of policy that is expected to help New Hampshire cost effectively meet its energy needs without paying for large infrastructure projects and dealing with the associated stranded-costs risk.
The relative net benefits of pipeline expansion, LNG contracting, and energy efficiency and demand reduction for New England were analyzed in a 2015 Analysis Group report34 that followed a transparent methodology and made assumptions based on the current state of the energy marketplace. Results showed all three scenarios having a significant positive return on investment for ratepayers (these returns do not include environmental benefits). The LNG contract scenario had the lowest annual cost ($18 million) and the highest anticipated return on investment (150 percent). The energy efficiency scenario had the highest annual cost ($101 million) but a return on investment (145 percent) similar to LNG. Pipeline expansion had an annual cost in between these two scenarios ($66 million), and a lower but still significant return on investment (92 percent). In terms of dollars, the energy efficiency scenario has the highest return on investment of $146 million versus $61 million for pipeline expansion and $27 million for LNG.
A measure of stranded-cost potential was developed by calculating the worst-case scenario for dollars at risk (a measure that indicates the magnitude of risk, not the likelihood). The LNG and energy efficiency scenarios have similar worst-case stranded-cost risk profiles, ranging between $90 million and $101 million. In contrast, the risk for the pipeline was about twenty times higher, at $1,980 million.
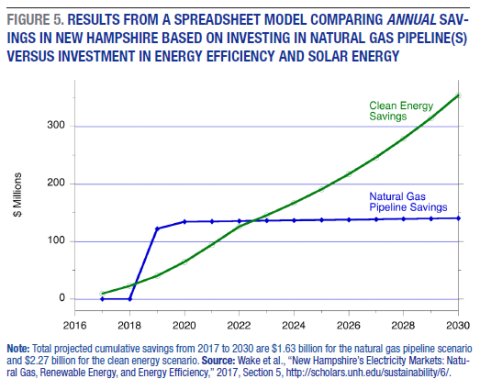
In response to a request from New Hampshire energy stakeholders for more New Hampshire-specific information, we developed a spreadsheet model to directly compare the net benefits of pipeline expansion versus expansion of energy efficiency and solar energy. The assumptions used to develop the model are detailed in Section 5 of the full report. The total estimated cost for the natural gas expansion scenario from 2017 to 2030 was $1.3 billion, and wholesale electricity cost savings (based on optimistic industry estimates) totaled $1.6 billion (Figure 5; note the figure shows annual saving). This produces a simple return on investment over the period of $1.30 for every dollar spent. The total estimated cost of the energy efficiency and solar energy scenario from 2017 to 2030 was $1.1 billion and the savings were $2.3 billion (without discounting for future value). This produces a simple return on investment of $2 for every dollar spent.
New Hampshire residents favor investment in renewable energy. In response to a Granite State Poll question35 on priorities for energy sources in the future, by almost a 3-to-1 margin respondents gave higher priority to renewable energy sources (67 percent) compared to natural gas (24 percent). Large majorities of self-reported political liberals (88 percent) and moderates (70 percent) preferred increased use of renewable energy sources, while self-described conservatives were as likely to prioritize natural gas (46 percent) as renewable energy (45 percent).
Conclusion
Our findings suggest that there is no immediate need for New Hampshire to expand natural gas pipeline infrastructure. If the state wishes to intervene in the market by obligating ratepayer funds to reduce wholesale electricity costs, additional public investment in major pipeline infrastructure should wait until a rigorous study has been completed that models system wide natural gas flows and prices. This study should lead to an improved understanding of the difference between the technical and economic capacity of the existing system and explore opportunities to access more of the technical pipeline capacity in cost-effective ways. To date, no study of which we are aware has performed the level of rigorous analysis required to justify a major multidecadal contract obligating ratepayers, and moving ahead without such a study would essentially make ratepayers energy market speculators. Policy makers also may want to consider other options that carry less risk and a better return on investment, including better utilization of existing infrastructure and increased investment in energy efficiency and renewable energy.
Contracts for natural gas capacity that are funded by ratepayers should be conducted through a request-for-proposals (RFP) process, as recommended by the Public Utility Commission.36 This process should examine all avenues of gas supply, including new pipelines, existing pipelines, and LNG capacity. The underlying costs and assumptions from vendor submissions should also be placed in the public domain for review. Since there is evidence that costs may be lower from more effective use of existing infrastructure, an RFP process would allow the least-cost option to be revealed through a fair, open, and competitive bidding process.37
Based on the detailed analysis provided in Sections 3 and 4 of the full report, and given the projected low peak-load growth and uncertainty in future energy markets, it is advisable to avoid expensive market interventions or, at minimum, to prioritize investments that have the highest return on investment, lowest projected cost, and lowest risk. This practice will serve to keep rates affordable by reducing spending on expensive utility infrastructure that has been demonstrated in the past to increase rates (for example, Merrimack Station).
The findings of this study suggest that the LNG contract scenario or renewable energy and energy efficiency investment (up to the maximal economic potential estimated by the Vermont Energy Investment Corporation to be approximately 6 percent of the total New Hampshire energy load38) will be the most cost-effective alternatives while also representing low financial risk to New Hampshire ratepayers. Furthermore, policies should consider the unintended or disproportionate impacts on the populations most negatively affected by increased energy prices, including large commercial and industrial users and low-income households. In conclusion, we argue that the while the utility companies’ stated goal of reducing electricity costs in the State is admirable, that ironically, their strategy of expanded natural gas capacity in the region funded by ratepayers poses a significant risk of raising electricity costs further.
Data
Energy data used in this brief are from the U.S. Energy Information Administration, ICF International, Inc. and PointLogic Energy, and Gross Domestic Product and Price Index data from U.S. Department of Commerce, Bureau of Economic Analysis. We also conducted a review of prior/existing studies that focused on natural gas infrastructure, and energy efficiency and renewable energy implementation. Citations provided in the endnotes and detailed in the full report, http://scholars.unh.edu/sustainability/6/.
Endnotes
1. U.S. Energy Information Administration, “Natural gas-fired electricity generation expected to reach record level in 2016,” July 14, 2016, https://www.eia.gov/todayinenergy/detail.php?id=27072.
2. ISO New England, “2016 Regional Electricity Outlook” (Holyoke, MA: ISO New England, 2016), http://www.iso-ne.com/static-assets/documents/2016/03/2016_reo.pdf.
3. E. Okun, “New England’s Energy Situation ‘Precarious,’ ISO Leader Says,” Union Leader, September 16, 2016, http://www.unionleader.com/energy/New-Englands-energy-situation-precario... ISO New England, “Natural Gas Infrastructure Constraints” (Holyoke, MA: ISO New England, n.d.), https://www.iso-ne.com/about/regional-electricity-outlook/grid-in-transi....
4. Wake et al., “New Hampshire’s Electricity Markets: Natural Gas, Renewable Energy, and Energy Efficiency” (Durham, NH: University of New Hampshire, 2017), http://scholars.unh.edu/sustainability/6/.
5. This is the latest aggregated data available from the U.S. Energy Information Administration (EIA) at the time of analysis; http://www.eia.gov/state/seds/seds-data-complete.cfm#CompleteDataFile.
6. U.S. EIA, “2014 Average Monthly Bill–Residential” (n.d.), https://www.eia.gov/electricity/sales_revenue_price/pdf/table5_a.pdf.
7. U.S. EIA, “2014 Average Monthly Bill–Commercial” (n.d.), https://www.eia.gov/electricity/sales_revenue_price/pdf/table5_b.pdf.
8. Lee Hansen, “Factors Behind Connecticut’s High Electricity Rates” (2015n.d.), Connecticut Office of Legislative Research, https://www.cga.ct.gov/2015/rpt/2015-R-0108.htm.
9. Some argue that many of these projects have been undertaken with limited cost oversight. See B. Scott, “Transmission Costs,” PowerPoint slides from presentation at the New Hampshire Energy Summit, Concord, October 3, 2016, http://dupontgroup.com/wp-content/uploads/2013/09/Commissioner-Scott-Tra... D. Brooks, “Growing Transmission Costs Are Raising Region’s Electricity Rates,” Concord Monitor, October 5, 2016, http://www.concordmonitor.com/energy-summit-NH-5137402.
10. G. Van Welie, “State of the Grid: 2016: ISO on Background” (Holyoke, MA: ISO New England, 2016), https://www.iso-ne.com/static-assets/documents/2016/01/20160126_presenta....
11. ISO New England, “2016 Regional Electricity Outlook” (Holyoke, MA: ISO New England, 2016), http://www.iso-ne.com/static-assets/documents/2016/03/2016_reo.pdf.
12. Okun, “New England’s Energy Situation ‘Precarious,’ ISO Leader Says”; ISO New England, “Natural Gas Infrastructure Constraints.”
13. P.J. Hibard and C.P. Aubuchon, “Power System Reliability in New England: Meeting Electric Resource Needs in an Era of Growing Dependence on Natural Gas” (New York, NY: Analysis Group, 2015),
http://www.analysisgroup.com/uploadedfiles/content/insights/publishing/p...
Black & Veatch, “Natural Gas Infrastructure and Electric Generation: Proposed Solutions for New England,” 2013, http://nescoe.com/uploads/Phase_III_Gas-Elec_Report_Sept._2013.pdf
La Capra Associates/ Economic Development Research Group, “The Economic Impacts of Failing to Build Energy Infrastructure in New England,” 2015, http://media.gractions.com/5CC7D7975DFE1335100A9E9B056042840005CCF0/25e7...
ICF International, “Access Northeast Project: Reliability Benefits and Energy Cost Savings to New England,” 2015, http://www.accessnortheastenergy.com/content/documents/ane/Key_Documents...
ICF International, “Assessment of New England’s Natural Gas Pipeline Capacity to Satisfy Short and Near- Term Electric Generation Needs,” 2012, http://psb.vermont.gov/sites/psb/files/docket/7862relicense4/Exhibit%20E...
Sussex Economic Advisors, “Maine Public Utilities Commission Review of Natural Gas Capacity Options,” 2014, https://www.iso-ne.com/static-assets/documents/committees/comm_wkgrps/ot...
ICF International, “Assessment of New England’s Natural Gas Pipeline Capacity to Satisfy Short and Near-Term Power Generation Needs: Phase II,” 2014, https://www.iso-ne.com/static-assets/documents/2014/11/final_icf_phii_ga...
Energyzt Advisors, “Winter Reliability Analysis of New England Energy Markets,” 2014, http://www.epsa.org/forms/uploadFiles/2CB910000000A.filename.Energyzt_NE....
14. ICF International, “Assessment of New England’s Natural Gas Pipeline Capacity to Satisfy Short and Near-Term Electric Generation Needs: Phase II,” 2014, https://www.iso-ne.com/static-assets/documents/2014/11/final_icf_phii_ga....
15. U.S. Energy Information Administration, "U.S. State-to-State Capacity," updated 12/31/2015, https://www.eia.gov/naturalgas/pipelines/EIA-StatetoStateCapacity.xls; U.S. Energy Information Administration, “New England Natural Gas Pipeline Capacity Increases for the First Time Since 2010,” December 6, 2016, https://www.eia.gov/todayinenergy/detail.php?id=29032.
16. Email correspondence with Warren Waite, PointLogic Energy, May 4, 2017.
17. ICF International, 2014.
18. Firm transportation services or firm capacity refers to contracts for a specific volume of natural gas through the pipeline and therefore those holding the contract have priority access to that specific volume of natural gas.
19. N. Hitchins and G. Maguire, “Generator’s Appetite to Finance Pipeline Capacity: New England and South Australia,” NERA Economic Consulting, 2015, http://www.nera.com/content/dam/nera/publications/2015/PUB_Generators_Ap....
20. North American Electric Reliability Corporation (2014 September) Polar Vortex Review. Available on-line at http://www.nerc.com/pa/rrm/January%202014%20Polar%20Vortex%20Review/Pola....
21. ISO New England, “Key Stats: New England’s Electricity Use” (Holyoke, MA: ISO New England, n.d.), https://www.iso-ne.com/about/key-stats/electricity-use; “ISO New England’s Forecast Report of Capacity, Energy, Loads, and Transmission,” CELT Report (n.d.), https://www.iso-ne.com/system-planning/system-plans-studies/celt.
22. ISO New England, “Power Plant Retirements” (Holyoke, MA: ISO New England, n.d.), https://www.iso-ne.com/about/regional-electricity-outlook/grid-in-transi...Elise Harmon, “New England’s Nuclear Power Plants Are Shutting Down, and That’s Bad News for Cutting Carbon Pollution,” November 21, 2016, New England Climate Change Review, https://www.northeastern.edu/climatereview/?p=189.
23. ISO New England, “Key Grid and Market Stats” (Holyoke, MA: ISO New England, n.d.), https://www.iso-ne.com/about/key-stats.
24. La Capra Associates/ Economic Development Research Group, “The Economic Impacts of Failing to Build Energy Infrastructure in New England,” 2015, http://media.gractions.com/5CC7D7975DFE1335100A9E9B056042840005CCF0/25e7....
25. New Hampshire Public Radio, “Northern Pass,” http://nhpr.org/topic/northern-pass; Society for the Protection of New Hampshire Forests, “The Northern Pass,” https://www.forestsociety.org/advocacy-issue/northern-pass.
26. See New England Clean Power Link: Project Development Portal, http://www.necplink.com; Renewable Energy World, “TDI New England Receives Major Regulatory Approval for Clean Power Link,” 2016, http://www.renewableenergyworld.com/articles/2016/01/tdi-new-england-rec....
27. For details, refer to Tables 2.1 and 2.2 in the full report, http://scholars.unh.edu/sustainability/6/.
28. Hibard and Aubuchon 2015; ISO New England, “Managing Reliable Power Grid Operations This Winter” (Holyoke, MA: ISO New England, 2016), https://www.iso-ne.com/static-assets/documents/2016/12/20161205_pr_iso-n....
29. B. Sanders, “Merrimack Scrubber at the Center of Eversource’s Divestiture Plan,” New Hampshire Business Review, March 19, 2015, http://www.nhbr.com/March-20-2015/Merrimack-scrubber-at-the-center-of-Ev....
30. B. Sanders, “PSNH turns to NH Supreme Court in Scrubber Showdown With PUC,” New Hampshire Business Review, September 27, 2013, http://www.nhbr.com/October-4-2013/PSNH-turns-to-NH-Supreme-Court-in-scr....
31. Public perception based on responses to energy related questions from 577 interviews conducted as part of the October 2016 Granite State Poll. For full description, see Section 6 of full report, http://scholars.unh.edu/sustainability/6/.
32. American Council for an Energy-Efficient Economy (ACEEE), “The 2016 State Energy Efficiency Scorecard” (Washington DC: ACEEE, 2016), http://aceee.org/research-report/u1606.
33. S. Nowak et al., “Beyond Carrots for Utilities: A National Review of Performance Incentives for Energy Efficiency” (Washington DC: ACEEE, 2016), http://kms.energyefficiencycentre.org/sites/default/files/u1504.pdf.
34. Hibard and Aubuchon, 2015.
35. New Hampshire Public Utilities Commission, “Report on Investigation Into Potential Approaches to Mitigate Wholesale Electricity Prices,” Report No. IR 15–124, September 15, 2015, http://www.puc.state.nh.us/Regulatory/Docketbk/2015/15-124/LETTERS-MEMOS....
36. Granite State Poll, 2016.
37. See Section 3 of the New Hampshire Public Utilities Commission report (ibid) for additional detail.
38. Vermont Energy Investment Corporation, “Efficiency in New Hampshire: Realizing Our Potential,” 2013, https://www.nh.gov/oep/resource-library/energy/documents/nh_eers_study20....
Acknowledgements
Support for this research was provided by the New Hampshire Chapter of The Nature Conservancy and the New Hampshire Community Development Finance Authority. We gratefully acknowledge the input and guidance at multiple stages provided by our Advisory Board, which included: Jesse Devitte (Borealis Ventures), Kate Epsen (NH Sustainable Energy Association), Michael Ettlinger (UNH Carsey School of Public Policy), Mike Fitzgerald (NH Department of Environmental Services), Richard Grogan (NH Small Business Development Center), Robert Mohr (UNH Paul College), Kevin O’Maley (City of Manchester), Venu Rao (Energy Committee in Hollis, NH), Jack Ruderman (Revision Energy), and Eric Worthen (Worthen Industries). The findings and recommendations presented in this brief remain those of the authors. The authors thank Michael Ettlinger, Michele Dillon, Curt Grimm, Amy Sterndale, Laurel Lloyd, and Bianca Nicolosi at the Carsey School of Public Policy and Patrick Watson for editorial contributions.