download the brief
Key Findings


African American children are growing up in dramatically smaller families than they were 50 years ago.1 At a postwar peak in 1960, the average black child was one of 6.53 siblings, but today he or she is one of 3.18 (see Box 1). This measure has also dropped, but less dramatically, for the average white child, for whom “sibsize” was 4.1 in 1960 and today is 2.93.2 When we compare children of poorly educated and well-educated mothers, whatever their race, we find a similar pattern of falling sibsize and reduced differences in sibsize over the past 50 years.3
Because large families must spread their resources among their children, these declines, especially among the less well-off, enable families to devote more resources to each child and are likely to have transformed children’s lives in a positive and egalitarian direction.4 This change is also likely to have had important implications for trends in poverty, though these implications have not been examined. Children in small families benefit simply by virtue of having limited resources divided fewer ways. As such, declining average sibsize since the mid-20th century is an important development in the United States.
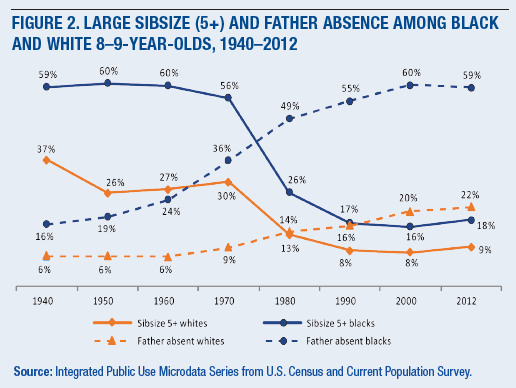
The drop in the number of siblings also raises a key question: is falling sibsize offsetting some of the harmful effects on children of the transition from two-parent families to single-parent families? This latter change has been widely noted and has caused great concern.5 The share of 8- and 9-year-old children whose father is absent from the family home has risen from 6 percent in 1960 to 22 percent in 2012 among whites and from 24 percent to 59 percent among blacks (see Box 2). At the same time, however, the share of 8- and 9-year-olds with sibsizes of five or more has fallen from 60 percent to 18 percent among blacks and from 27 percent to 9 percent among whites. Was it more challenging for children in the 1960s to grow up with two resident parents and many siblings than it is for children today to grow up with one resident parent and fewer siblings? This is a key question to ask in assessing what role family change has played in shaping the course of social inequality in America over the past half-century.
Note: In this brief, Hispanics may be of either race, and we have not analyzed Hispanic sibsize trends separately. See the discussion in the concluding paragraphs.
The large family and the fractured family are each socially and economically vulnerable in their own way. Fifty years ago the large family was the most common family type for less well-off children; today the fractured family is. This means that the type of family vulnerability faced by poorer children has changed, but, given the challenges associated with both large and fractured families, it may not mean that the absolute level of family vulnerability that children face has increased, as usual accounts of the rise of mother-headed families imply. The research agenda in this important field needs to be reframed to take this idea into account and thereby avoid an incomplete reading of how family change has affected American children.
One reason why the decline in family size has not generally been seen as having the significance described here is that traditional measures do not look at family size from a child’s perspective, that is, with a focus on sibsize. It is usual to look instead at how many children women have. In terms of population averages, these are quite different things. Groups of women always have a mix of large and small families, and the average family size for women falls somewhere in the middle. For children, however, average sibsize is tilted toward the larger families because these have more children to be included in the calculations. In America today, for example, the proportion of women who have only one child (17 percent) is considerably greater than the proportion who have a large family (11 percent have four children or more). But for their children, the relative importance of these two ends of the family-size range is the other way around: far more children grow up in families of four children or more (26 percent) than grow up in one-child (one-sibsize) families (9 percent). The result is that the average American woman today has two children, but the average American child is one of three siblings (see Box 3 for examples of the arithmetic). The two-child average for women is well known, but the average sibsize of three among children is usually overlooked.
The often wide difference between women’s and children’s family size was first pointed out many decades ago but has since been largely forgotten.6 It needs to be remembered and explored if we want to understand how family change has affected children’s well-being in the United States over recent decades.
This brief, and the paper from which it is derived, are meant to re-introduce the sibsize approach. Further work using this frame is warranted: much more needs to be known about how, why, where, and when the long-term decline in sibsize occurred and what effects it has had on children. Present-day sibsize patterns also need to be closely studied. Although sibsize is smaller and less disparate by race and social class than it used to be, it is larger than most people realize and could be larger still in some regions or among some ethnic groups.
The overall lesson is that to understand how family change and current family patterns affect children’s well-being, the hidden story of children’s sibsize needs to be recognized and fully explored.
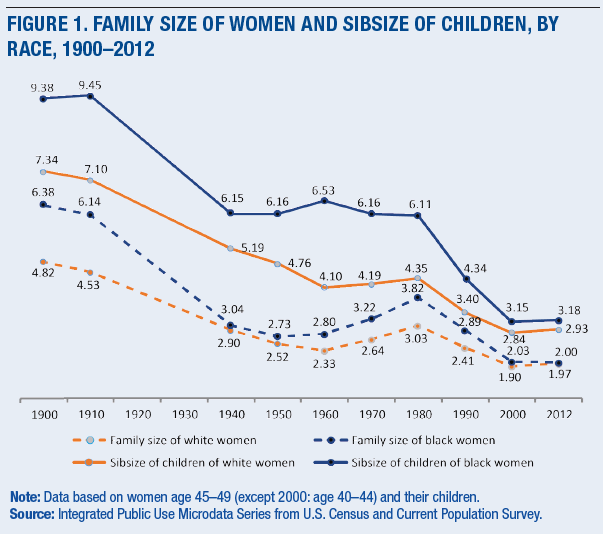
Box 1. The paradox of race and family size in 20th century America
By the middle of the 20th century, demographers came to the conclusion that family size in America had become quite small by historical standards and racially quite similar. This conclusion is shown to be justified by the dashed lines in the graph above. These lines plot the mean number of births to women by the time they reached their late 40s and show a clear trend toward smaller numbers of children and racial convergence in family size by the mid-century. The paradox is that, for those women’s children, family size in the mid-20th century was neither small nor racially similar but instead was large and more unequal than at any other time in the century. For black children, mean sibsize remained above six throughout the mid-century, and in 1960 it was 2.43 siblings greater than the mean sibsize among white children. This black-white gap in sibsize was slightly larger than it had been at the previous peak in 1910 (when it was 2.35). It was only as the 20th century came to a close that the picture of “small and racially similar” came to be true of children’s sibsize, thereby opening up a novel period of racial parity in this important aspect of children’s lives.
The very big difference between women’s and children’s family size in mid-20th century America was due to the extreme mix of childlessness and large families among women, especially among black women. In 1960, for example, one-third of black women in their mid-40s were childless (most of these were married). Only one in eight black women had seven or more children, but these families accounted for 46 percent of black children. The fall in children’s family size as the 20th century came to a close occurred because both extremes of family size reduced. Fewer women remained childless and fewer had large families, and this caused children to be more clustered into families of moderate size than had been the case earlier in the 20th century.
Box 2. As the racial gap in father absence among children widened in America, the racial gap in children’s family size became narrower
In the famous “Moynihan Report” of 1965, Daniel Patrick Moynihan raised an alarm about the rising share of black children who were growing up in mother-headed families. At that time, as the graph above confirms, Moynihan’s concern had some justification, given that one in four black children (24 percent) were in families where no father was present, a much higher share than among white children in such families (6 percent). Since then, father absence has become more common, and much more among black than white children. This development has caused worry about the effects for children and also about the widening social inequalities among children that it creates.
At the time, Moynihan overlooked another feature of children’s family contexts that also differed by race: the proportions living in large families, defined in the graph above as those with five or more siblings. In the decades from the 1940s to the 1960s, far more black children were in large families than white children. Then, in the 1970s and 1980s, the share of children in large families plummeted and did so especially for black children. The result was that by the 1990s, far fewer children were in large families, and the gap between black and white children on this measure, while still present, was on a much smaller scale. In other words, as family conditions for children had worsened and became more racially disparate in regard to father absence, they had improved and became less racially disparate in regard to family size.
Box 3. How can family size differ so much between mothers and their children?
For an individual family, there is no difference between the family size of the mother and sibsize among her children: if a mother has three children, each of her children is one of three siblings. For group averages, however, things are more complex. To take an example, if we had a group of two women—let’s call them Mary and Jane—who had six children between them, their mean family size would be three. That mean would remain at three irrespective of how the children were split between Mary and Jane: whether the divide was three and three, four and two, five and one, or six and none, the children would always sum to six, there would be two women in each case, and the mean number of children per woman would be a constant 6/2=3.
For the children, however, the picture is different because their mean sibsize is affected by the distribution of the children among their parents. With Mary and Jane’s children, for example, if five were Mary’s and one were Jane’s, we would have five children with a sibsize of five and one with a sibsize of one. That would translate into a mean sibsize of 4.33, which is 44 percent greater than the mean number of children of their mothers (the calculation of the mean sibsize in this case is 5x5 + 1x1=26, divided by 6 = 4.33 recurring).
The rule is that the mean family size of a group of women and the mean sibsize of their children will match only when all the women have exactly the same number of children (that is, in Mary and Jane’s case, if they had three children each, in which case all the children would have a sibsize of three). Otherwise, women’s mean family size will always be less than their children’s mean sibsize. Moreover, the gap between the two will increase as the distribution of the children across the group of women becomes more uneven. Thus, in the Mary and Jane example, if the distribution became so uneven that Mary had six children and Jane had none, the mean family size of the women would still be three but the children’s mean sibsize would rise to six, since all the children would be in the family with six children.
Data
The data for this brief are drawn from the Integrated Public Use Microdata Series from the U.S. Census and the Current Population Survey. See S. Ruggles, K. Genadek, R. Goeken, J. Grover, and M. Sobek, Integrated Public Use Microdata Series: Version 6.0 [machine-readable database], Minneapolis: University of Minnesota, 2015; S. Flood, M. King, S. Ruggles, and J. Robert Warren, Integrated Public Use Microdata Series, Current Population Survey: Version 4.0 [machine-readable database], Minneapolis: University of Minnesota, 2015.
Endnotes
1. This brief is based on T. Fahey, “The Sibsize Revolution and Social Disparities in Children’s Family Contexts in the United States, 1940–2012,” Demography 54, no. 3 (2017): 813-34, DOI 10.1007/s13524-017-0568-0, also available at http://rdcu.be/qZWS.
2. ‘Sibsize’ means the number of siblings in the child’s sibling group where an only child is counted as having a sibsize of one.
3. Analysis of sibsize differences by maternal education is provided in Fahey 2017.
4. Research over many decades has shown that, in the United States, children with few siblings do better in life than those with many (L.C. Steelman, B. Powell, R. Werum, and S. Carter, “Reconsidering the Effects of Sibling Configuration: Recent Advances and Challenges,” Annual Review of Sociology 28 (2002): 243–69). In other countries, where public supports for large families are stronger, the disadvantages associated with having many siblings are much less (B.G. Gibb, J. Workman, and D.B. Downey, “The (Conditional) Resource Dilution Model: State and Community Level Modifications,” Demography 53, no. 4 (2016): 723–48).
5. See, for example, Sara McLanahan, “Diverging Destinies: How Children Are Faring Under the Second Demographic Transition,”’ Demography 41, no. 4 (2004): 607–27, and Isabel V. Sawhill, Generation Unbound: Drifting Into Sex and Parenthood Without Marriage (Washington: DC: Brookings Institution Press, 2014).
6. The demographer Samuel Preston was the first to set out the statistical technicalities of the difference between women’s and children’s family size and show its substantive importance; see his “Family Sizes of Children and Family Sizes of Women,” Demography 13, no. 1 (1976): 105–14. Judith Blake picked up on Preston’s analysis and called for the child’s perspective on family size to be included in the study of family change in America (see Chapter 8 in her Family Size and Achievement, University of California Press, 1989). That call was not subsequently followed up.
Acknowledgments
The research was funded from the general research resources of University College, Dublin, Ireland. No external research funding was received.