download the brief
Key Findings


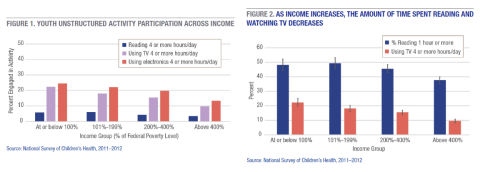
The share of youth who are reading, using television, and using electronics is comparable across income groups, though lower-income youth report participating in these activities for longer hours than their higher-income counterparts.
Research on narrowing the academic achievement gap between lower- and higher-income youth tends to focus on the inputs provided by schools. Little attention, however, is paid to extracurricular activities, both structured and unstructured, even though extracurricular participation and employment can have positive impacts similar to in-school experiences. Such activities keep adolescents engaged during high-risk hours, and consistent participation is linked to improved academic achievement and prosocial behaviors.1 Extracurricular activities are also influential in the college admissions process as well as in healthy development and academic success.2
This brief uses data from the 2012 National Survey of Children’s Health to examine involvement in activities among youth ages 12–18 across income categories and metropolitan status3 in the hopes of informing policy aimed at attenuating inequalities in participation. While not a complete profile of youth activities (time spent on homework, care of younger siblings, or housework, for example, are not included), determining participation rates helps us understand what youth are doing in their out-of-school hours and how these activities vary by income and metropolitan status. Access to extracurricular activities and employment is growing more unequal,4 and as a result lower-income youth may be increasingly disadvantaged compared to middle- and upper-income children.5 See Box 1: Definitions.
Youth Participation in Structured Activity Varies by Income and Metropolitan Status
Higher-income youth are more likely to participate in extracurricular activities than are lower-income youth, regardless of type of activity (Figure 1). Youth in the lower-income group most often participate in sports, while those in the higher-income group have the highest participation in clubs. The differences between rural and urban youth involvement in extracurricular activities (not shown in figure) are small yet still noteworthy—participation is approximately 4 percentage points higher among urban youth than rural youth.
Youth Employment Rates Vary by Income and Metropolitan Status
As income increases, so does the percentage of youth working, such that the highest-income group has nearly double (33 percent) the rate of youth employment as the lowest-income group (17 percent) (Figure 2). A greater proportion of rural youth are employed than their urban counterparts, with an average difference of 5 percentage points.
Lower-Income Youth Spend More Time in Unstructured Activities
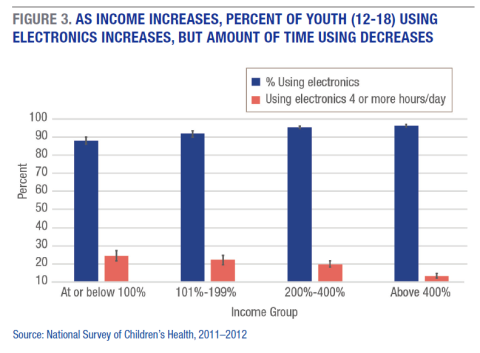
Except for use of electronics, where more higher-income youth report usage than do lower-income youth, there were no differences in overall rates of participation in unstructured activities (reading for pleasure, using TV, using electronics) between income groups. However, as income increases, the percentage of youth engaged in these activities (four or more hours per day) decreases. (Figure 3). This trend is consistent across metropolitan status.
Discussion
Research shows that youth engagement in extracurricular activities and employment positively impacts student achievement and future earnings.6 Yet it also shows that the income gap in extracurricular participation is increasing,7 and that higher-income households are spending significantly more time than lower-income households on structured extracurricular and enrichment activities.8 Research has not broadly addressed what lower-income youth are doing instead.
This brief begins to illustrate what youth may be doing with their time and how activities vary by socioeconomic status and place of residence. Income-based disparities are evident. These results are consistent with previous research showing that participation in extracurricular activity varies by income, yet the reasons for this difference are still unclear. It is possible that financial costs, eligibility for, and availability of extracurricular activities, among other factors, could impact participation among lower-income youth.
For example, many schools have strict guidelines and requirements, such as a minimum grade point average (GPA), which must be met before a student can participate in a school-sponsored extracurricular activity. If low-income youth have lower academic achievement, as some research shows, their opportunity to participate in school-based extracurricular activities will be diminished.9 In turn, since extracurricular participation is linked to better grades, decreased participation could also lead to poorer academic achievement. Additionally, previous research suggests that the duration, number of activities, and breadth of participation positively impact adolescent adjustment, psychological competencies, and peer interactions.10 Therefore, the relationship between extracurricular participation, academic success, and well-being is potentially linked in complex ways. More research is necessary to determine how income and metropolitan status affect activity participation and how the consequences resulting from limited or non-participation affect youth.
That employment rates were greater among higher-income youth is perhaps surprising, since one might expect that lower family income would prompt higher rates of youth work participation or longer hours. These findings suggest that youth employment itself has become another extracurricular activity. This possibility could explain why rural youth are more likely to work: if fewer traditional extracurricular opportunities are available in rural areas, employment may serve as a replacement.
This research brings to light an important issue in education. Policy makers and school systems may consider creating spaces for youth to participate in extracurricular activities across all income ranges by making participation affordable and accessible for everyone. Colleges and universities could reconsider admissions policies that are heavily influenced by extracurricular involvement. Primary and secondary schools might think about changing their minimum GPA and other eligibility requirements for participation in school-based extracurricular activities to allow greater access by lower-income students.
Data and Methodology
The National Survey of Children’s Health (NSCH) collects data on children approximately every four to five years (the most recent years were 2003, 2007, and 2011–2012) from a representative population of 95,667 children age 0–17 years on multiple aspects of their lives, including physical and mental health, school, and neighborhood.11 Questions of interest to this project are after-school activities, employment history, family income, and metropolitan status. Telephone interviews are used to identify households with children, and one child is randomly selected to be the subject of the interview. Questions about the children are answered by the parent/guardian in the household. The Maternal and Child Health Bureau, U.S. Department of Health and Human Services provides the primary funding for the survey, and the data collection process is overseen by the Centers for Disease Control and Prevention.
This brief uses the 2011–2012 data and limits the sample to children age 12–18, which reduces the sample size to 34,677. Comparisons were made overall and between income groups and metropolitan status. Youth were separated into four income groups and are compared on each question (for example, does your child work?).
Box 1: Definitions
Lower income—At or below 100 percent or between 101 percent and 199 percent of the federal poverty level.
Higher income—Between 200 percent and 400 percent or above 400 percent of the federal poverty level.
Extracurricular activity—A school-based or extramural activity that is not required by the school and not eligible for school credits. Includes sports, clubs, and “other structured activity.”
Structured activity—Organized activities that can occur indoors or outdoors and are directed by an adult. Extracurricular activities and participation in sports and clubs are considered to be structured activities.
Unstructured activity—Activities such as reading for pleasure, using television, which includes playing video games, and using electronics, such as computers and tablets. Does not include time spent on homework or interacting with friends.
Sports—Both intramural and out-of-school sports participation.
Clubs—Any group of two or more people united by a common interest or goal; clubs are typically school-based, but can be outside of school as well.
Other structured activity—Any structured activity other than a sport or club, such as dance, music, or scouts.
Metropolitan status—Classification of youth residence as either urban or rural.
Urban—Areas within a metropolitan statistical area that contain a population of 50,000 or greater.
Rural—All areas that are not within a metropolitan statistical area. Also referred to as non-metro.
Endnotes
1. J.F. Zaff et al., “Implication of Extracurricular Activity Participation During Adolescence on Positive Otcomes,” Journal of Adolescent Research 18 (2003): 599–630; A.T. Vazsonyi and J.B. Snider, “Mentoring, Competencies, and Adjustment in Adolescents: American Part-Time Employment and European Apprenticeships,” International Journal of Behavioral Development 32, no. 1 (2008): 46; K.J. Quirk, T.Z. Keith, and J.T. Quirk, “Employment During High School and Student Achievement: Longitudinal Analysis of National Data,” Journal of Educational Research 95, no. 1 (2001): 4.
2. M.E. Clinedinst and D.A. Hawkins, State of College Admission (Washington, DC: National Association for College Admission Counseling, 2011); J.S. Eccles et al., “Extracurricular Activities and Adolescent Development,” Journal of Social Issues 59, no. 4 (2003): 865–89; V. Bornschier, “Changing Income Inequality in the Second Half of the 20th Century: Preliminary Findings and Propositions for Explanations,” Journal of World-Systems Research 8, no. 1 (2015): 100–27.
3. It should be noted that parents or guardians reported on whether a youth participated in an activity and for how long; these results may be different if the reports were by the youth themselves. Income categories are: at or below 100 percent of the federal poverty line, 101–199 percent, 200–400 percent, and above 400 percent. The study was limited to such groups due to the format and construct of the dataset. The only available measure of income was categorized in these groups. Metropolitan status can be urban or rural; see Box 1.
4. K. Snellman et al., “The Engagement Gap: Social Mobility and Extracurricular Participation Among American Youth,” Annals of the American Academy of Political and Social Science 657, no. 1 (2015): 194–207; Lingqian Hu, “Changing Job Access of the Poor: Effects of Spatial and Socioeconomic Transformations in Chicago, 1990–2010,” Urban Studies 51 (March 2014): 675–92; Steven Horwitz, “Breaking Down the Barriers: Three Ways State and Local Governments Can Get Out of the Way and Improve the Lives of the Poor” (Arlington, VA: Mercatus Research, Mercatus Center at George Mason University, July 2015).
5. Annette Lareau coined the phrase “cultivated child” to refer to the middle/upper class phenomenon in which engagement in multiple activities increases a child’s skill set and experience, consequentially increasing his or her ability to attend higher education and be hired. See Lareau’s book, Unequal Childhoods: Class, Race, and Family Life (Berkeley: University of California Press, 2003).
6. C. Lleras, “Do Skills and Behaviors in High School Matter? The Contribution of Non-Cognitive Factors in Explaining Differences in Educational Attainment and Earnings,” Social Science Research 37, no. 3 (2008): 888–902; M.A. Painter, “Get a Job and Keep It! High School Employment and Adult Wealth Accumulation,” Research in Social Stratification and Mobility 28, no. 2 (2010): 233–49; J. Mortimer, “The Benefits and Risks of Adolescent Employment,” The Prevention Researcher 17, no. 2 (2010): 8–11.
7. Snellman et al., 2015.
8. S. Kornrich and F. Furstenberg, “Investing in Children: Changes in Parental Spending on Children, 1972–2007,” Demography 50, no. 1 (2013): 1–23.
9. S. R. Sirin, “Socioeconomic Status and Academic Achievement: A Meta-Analytic Review of Research,” Review of Educational Research 75, no. 3 (2005): 417–53.
10. J.A. Fredricks and J.S. Eccles, “Extracurricular Involvement and Adolescent Adjustment: Impact of Duration, Number of Activities, and Breadth of Participation,” Applied Developmental Science 10, no. 3 (2006): 132-46.
11. National Survey of Children’s Health (2016), retrieved from http://childhealthdata.org/learn/NSCH. 2011-2012 National Survey of Children’s Health, Maternal and Child Health Bureau in collaboration with the National Center for Health Statistics, Stata 2011/12 NSCH Indicator Data Set prepared by the Data Resource Center for Child and Adolescent Health, Child and Adolescent Health Measurement Initiative, www.childhealthdata.org.
Acknowledgements
This brief was supported by the Annie E. Casey Foundation. The author thanks the following for guidance and editorial contributions: Beth Mattingly, Jessica Carson, and Andrew Schaefer at the Carsey School of Public Policy; Erin Hiley Sharp in the Human Development and Family Studies Department; and Child and Family Policy Consultant, Ruth Friedman. And thanks to Michele Dillon, Michael Ettlinger, Curt Grimm, and Amy Sterndale of the Carsey School of Public Policy for comments and suggestions; Patrick Watson for editorial assistance; and Laurel Lloyd and Bianca Nicolosi at the Carsey School for layout assistance.