Key Findings
The economic turbulence beginning with the Great Recession of 2007 and continuing through the next decade had a significant demographic impact on rural America. Recent data from the 2020 Census reveal that the rural population declined between 2010 and 2020.1 The loss was minimal, just 289,000 (-0.6 percent) out of 46 million, but it is the first decade-long rural population loss in history. In contrast, the rural population grew by 1.5 million between 2000 and 2010, and by nearly 3.4 million in the 1990s. Just 33.1 percent of rural counties gained population between 2010 and 2020, compared to 53.2 percent in the prior decade. Population growth was impacted in metropolitan areas as well, but the urban population continued to grow between 2010 and 2020. Thus, both rural and urban America have been buffeted by the aftermath of the Great Recession, which continued to exert a significant impact on migration, fertility, and mortality throughout the decade.
Population growth or decline depends on the balance between natural change (births minus deaths) and net migration (in-migrants minus out-migrants). Between 2010 and 2020, the United States experienced the least population growth since the 1930s because of the economic turbulence of the Great Recession and its aftermath. During the decade, immigration to the United States slowed and internal migration diminished because residents were frozen in place by high unemployment, housing debt, and poor economic prospects. At the same time, natural increase declined because there were fewer births and more deaths. In 2020, fertility rates hit record lows and there were the fewest births since 1979. At the same time, deaths were at record highs because of population aging and growing deaths of despair (including from drug overdoses and suicide).
These changes in national demographic trends had significant implications for rural America. A key question is how did the components of demographic change combined to produce the population loss in nonmetropolitan areas after 2010? The rural population declined because more people moved out than moved in, and because diminishing rural births only minimally exceeded the rising number of deaths. Between 2010 and 2020, the rural population declined by 289,000 because the net migration loss of 510,000 reduced the rural population by -1.1 percent, a loss which exceeded the gain from natural increase of 221,000 (0.5 percent). In contrast, in the prior decade, the rural population grew by 1,516,000 (3.4 percent) because there was a net gain of 464,000 migrants (1.0 percent) plus 1,052,000 more births than deaths (2.4 percent) (Figure 1). The shift from net migration gain to loss was widespread. Just a third of rural counties had migration gains between 2010 and 2020, compared to 45 percent between 2000 and 2010. In contrast, the metropolitan migration gain remained stable over the two decades.
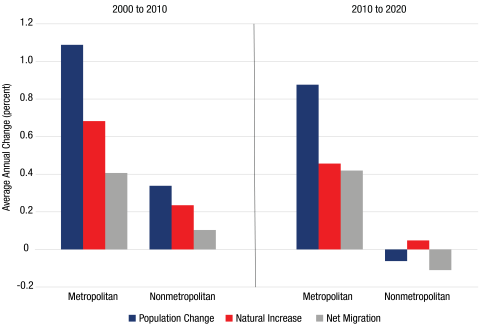
Source: Census Bureau, Census of 2020, 2010, and 2000 and Census Estimates. Analysis: K.M. Johnson, University of New Hampshire.
The sharp reduction in natural increase following the Great Recession had a significant impact because it traditionally produced most of the rural population gain, as it did between 2000 and 2010. However, between 2010 and 2020 natural increase contributed only 21 percent as many new residents to rural America as it had in the last decade. This small gain from natural increase was not sufficient to offset the net migration loss. Fewer births and more deaths also increased the number of rural counties experiencing natural decrease (when more people die than are born). Between 2010 and 2020, deaths exceeded births in 55 percent of nonmetropolitan counties, up from 37 percent in the previous decade. This is the highest incidence of rural natural decrease in history, and it predates the onset of COVID-19, which is likely to further accelerate the incidence of natural decrease.
Nonmetropolitan America spans nearly 70 percent of the land area of the United States. Demographic trends in this broad expanse are far from monolithic. Some rural regions experienced widespread population declines, while other rural regions continued to gain population—though at a slower pace than in prior decades (Figure 2). Population gains were widespread in the West and parts of the Southeast. Growth was also evident in many recreational areas of the upper Great Lakes, the Ozarks, and Great Smokies and in northern New England. There were also modest gains just beyond the periphery of some large urban areas in the Northeast. In contrast, population losses were common in large segments of the agricultural heartland of the Great Plains and Corn Belt, as well as in the Mississippi Delta, parts of the northern Appalachians, and in much of the mixed agricultural and industrial belts of New York, Pennsylvania, Ohio, Indiana, and Illinois.
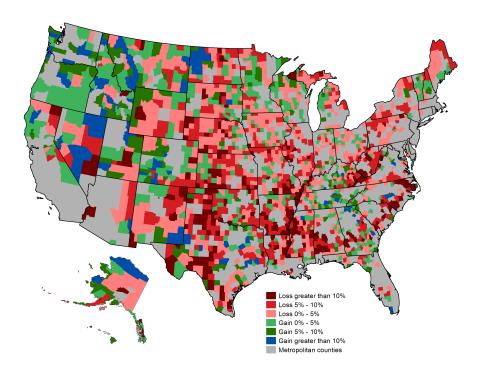
Source: Census Bureau, Census of 2020 and 2010. Analysis: K.M. Johnson, University of New Hampshire.
Just as rural demographic change varied geographically, it also differed across the continuum of rural places ranging from rural counties with large towns just beyond the urban edge to counties far removed from metropolitan areas. Historically, rural counties adjacent to metropolitan areas have grown because of their proximity to urban employment and services, and because urban sprawl spilled over into them. In contrast, rural areas far removed from metropolitan areas, especially if they had no large towns, grew the least, if at all. These traditional patterns of rural population change are evident between 2000 and 2010, when nonmetropolitan counties are divided into four groups based on their adjacency to metropolitan areas and whether they are micropolitan—have a town with between 10,000 and 50,000 residents (Figure 3). Population gains were greatest (4.8 percent) in adjacent counties that contained a large town (Adjacent Micropolitan), because natural increase increased the population by 3.0 percent and a migration gain contributed another 1.8 percent to the rural population.
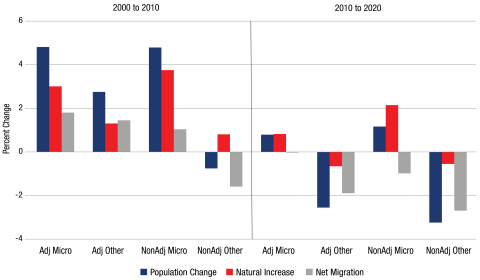
Source: Census Bureau, Census of 2020, 2010, and 2000 and Census Estimates. Analysis: K.M. Johnson, University of New Hampshire.
Population gains were modest (2.8 percent) in adjacent counties that were not micropolitan (Adjacent Other) because of smaller contributions from natural increase (1.3 percent) and migration (1.5 percent). Among counties that were at some distance from metropolitan areas, those that had a large town (Nonadjacent Micropolitan) grew as rapidly (4.8 percent) as their adjacent counterparts. However, here natural increase accounted for a considerably larger share of the gain, increasing the population by 3.8 percent, compared to a migration gain that increased the population by 1 percent. Far from a metropolitan area, such large towns often serve as a locus for local employment, services, and activity. In contrast, nonadjacent counties without a large town (Nonadjacent Other) were the only group to lose population (-0.8 percent) between 2000 and 2010 because migration reduced the local population by -1.6 percent which exceeded the population gain from natural increase of 0.8 percent.
Rural demographic change between 2010 and 2020 contrasts sharply with the traditional trends of the previous decade. Only micropolitan counties gained population, and the gains in both Adjacent Micropolitan (0.8 percent) and Nonadjacent Micropolitan counties (1.2 percent) were less than a quarter of what they had been in the prior decade. Fewer than half the counties in each micropolitan group gained population during the decade. Among counties without a large town, the population declined by 2.5 percent in Adjacent Other and 3.2 percent in Nonadjacent Other counties, with more than 70 percent of each county group losing population. All four county groups experienced net outmigration, with the largest migration losses in the counties without a large town. Natural increase also diminished sharply in all four groups. The population declined among both county groups without a large town because more people died there than were born. Deaths exceeded births in more than 60 percent of these counties. Even among the micropolitan counties, natural increase was minimal, and nearly 40 percent of these counties had more deaths than births.
Given the economic turbulence of the past decade, rural demographic change also varied depending on a county’s economic base. Farming no longer dominates the rural economy, but it remains the most important economic activity in 443 rural counties. Nearly 78 percent of these counties lost population between 2010 and 2020 because minimal gains from natural increase were not enough to offset migration losses. Nearly 65 percent of the 357 counties dominated by manufacturing—traditionally a bright spot of rural demographic change—also lost population because migration losses exceeded dwindling natural increase. The demographic story was different in the overlapping groups of 296 nonmetropolitan recreational counties and 193 retirement destination counties which have natural amenities, recreational opportunities, or quality-of-life advantages. Here population gains were widespread because migrants were attracted by the proximate natural and built amenities and related economic opportunities. Though migration gains were smaller than in previous decades, they still produced a population gain in nearly 60 percent of the recreational and retirement destination counties. These four groups do not encompass all nonmetropolitan counties, but they illustrate that rural demographic change is far from monolithic.
Between 2010 and 2020 population loss was widespread across rural America, with more than two-thirds of all nonmetropolitan counties losing population. Natural increase, which traditionally provided much of the rural population gain, diminished almost everywhere. In addition, more people left rural America than moved to it. As a result, nonmetropolitan America experienced an overall population loss for the first time in history. Population losses were greatest in rural counties that were far from metropolitan areas and did not include a large town. But even among counties proximate to urban areas that did include a large town, population gains were far less than in the previous decade.
This research demonstrates that the economic turbulence of the Great Recession and its aftermath had significant repercussions for demographic trends in nonmetropolitan America. If rural outmigration is ongoing, and deaths continue to exceed births in many rural areas due to low fertility and higher mortality among the aging rural population, then population losses are likely to continue in much of rural America. This research predates the onset of COVID-19, which generated additional social, economic, and epidemiological turbulence that significantly increased rural deaths and discouraged births. The recent population losses in nonmetropolitan counties, fostered by the turbulence of the last decade and soon to be exacerbated by COVID-19, may foster even more widespread population loss in the future. This will increase the incidence of rural depopulation, a downward demographic spiral that is already occurring in 35 percent of rural counties. Such depopulating rural counties face significant challenges maintaining critical infrastructure needed to provide quality health care, education, and a viable economy for the remaining residents.
Just as demographic trends shifted with the onset of the Great Recession, they may be shifting again. Recent estimates suggest that Adjacent Micropolitan counties may again be experiencing net migration gains and that migration losses have diminished in Other Adjacent counties. There is, however, no evidence of renewed natural increase in the recent data. These recent fluctuations in rural demographic trends underscore the importance of continuing to monitor population redistribution trends in an ever-changing rural America.
These findings are relevant to scholars, policymakers, and the media at a time when there is considerable interest in rural America. The demographic changes that are reshaping nonmetropolitan areas are important to contemporary policy making intended to increase the viability of rural communities and enhance their contribution to the nation’s material, environmental, and social well-being.
This analysis is based on data from the 2020 Census and additional data from the Census Bureau Population Estimates Program. It spans the period from April 1, 2000 to April 1, 2020, so it predates the onset of the COVID-19 pandemic. The Census Bureau estimation algorithms use 2020 Census data, provisional birth and death data from the National Center for Health Statistics, and additional administrative data to estimate current demographic trends. Readers should recognize that although this analysis uses the best data available and is likely to be indicative of current trends, the data remain estimates. Concerns about both the quality of the 2020 Census and the impact of the Census Bureau’s Differential Privacy algorithms on the accuracy of the 2020 Census remain unresolved. Counties were classified as metropolitan or non-metropolitan using criteria developed by the U.S. Office of Management and Budget. The 2013 metropolitan/non-metropolitan classifications were applied retrospectively to 2000 in order to remove any effect of reclassification. The terms rural and non-metropolitan are used interchangeably, as are the terms urban and metropolitan.

Kenneth M. Johnson is senior demographer at the Carsey School of Public Policy, professor of sociology at the University of New Hampshire, and an Andrew Carnegie Fellow. His research was supported by a UNH Faculty Scholar Award and by the New Hampshire Agricultural Experiment Station in support of Hatch Multi-State Regional Project W-4001 through joint funding of the National Institute of Food and Agriculture, U.S. Department of Agriculture, under award number 1013434, and the state of New Hampshire. The opinions are his and not those of the sponsoring organizations. The research assistance of Kristine Bundschuh and GIS work of Barb Cook are gratefully acknowledged.
1. This brief examines rural demographic trends using data from the 2020 Census through April 1, 2020. As such, it predates the COVID-19 pandemic.