Key Findings
The U.S. population grew just 7.4 percent since 2010 according to the first data from the 2020 Census: the second smallest percentage decennial gain in history and more than 2 percentage points less than the gain between 2000 and 2010. This small population gain occurred because immigration diminished and because there were fewer births and more deaths (natural change). The combination of modest immigration and less natural change produced a population gain of just 22.7 million from 2010–2020 compared to 27.6 million from 2000–2010.
Substantial Population Gains in Some States, Losses in Others
The overall modest gain in U.S. population is a composite of widely varying growth among the states. Most of the nation’s largest relative population gains were concentrated in states in the South and West (Figure 1). Population losses or small gains were widespread in the Northeast and Midwest. In all, 14 states had population gains exceeding 10 percent, 14 gained 5–10 percent, and 20 gained less than 5 percent. Three states—Illinois, West Virginia, and Mississippi—lost population.
The six states that gained congressional seats—Texas (2 seats), Colorado, Florida, Montana, North Carolina, and Oregon—all had population gains exceeding 9.5 percent. Of the seven states that lost a seat—California, Illinois, Michigan, New York, Ohio, Pennsylvania, and West Virginia—only California had a population gain greater than 4.3 percent.
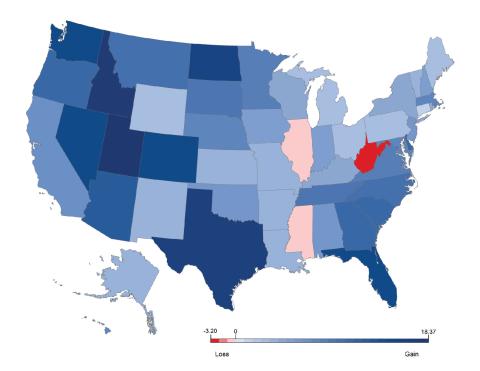
Source: U.S. Census, 2010 and 2020. Analysis: K.M. Johnson, Carsey School, University of New Hampshire.
About the Author

Kenneth M. Johnson is senior demographer at the Carsey School of Public Policy, professor of sociology at the University of New Hampshire, and an Andrew Carnegie Fellow. His research was funded by the New Hampshire Agricultural Experiment Station in support of Hatch Multi-State Regional Project W-4001 through joint funding of the National Institute of Food and Agriculture, U.S. Department of Agriculture, under award number 1013434, and the State of New Hampshire. The opinions are his and not those of the sponsoring organizations. Barbara Cook of the Carsey School provided the maps and Kristine Bundschuh of the Department of Sociology provided research assistance on the project.
Migration Fueled Gains in Some States, Losses in Others
The demographic forces that diminished U.S. population growth also influenced state population change, though there is an important difference. The nation’s migration gain comes only from net immigration from other countries, but state migration gains or losses also include domestic migration—people moving between states. Florida gained an estimated 2.4 million migrants and Texas gained almost 2 million. Both domestic migration and immigration contributed to these substantial migration gains. The additional congressional seats Texas and Florida gained are due, in large part, to these migration gains. In contrast, Illinois lost a congressional seat due to a migration loss of over 500,000 because immigration wasn’t sufficient to offset substantial domestic outmigration. Florida, Idaho, and Nevada were the only states with migration gains in excess of 10 percent (Figure 2). An additional 15 states had migration gains of 5 to 10 percent and 23 gained less than 5 percent. In contrast, 10 states had a net migration loss.
Figure 2. Percent Net Migration Change, 2010 to 2020
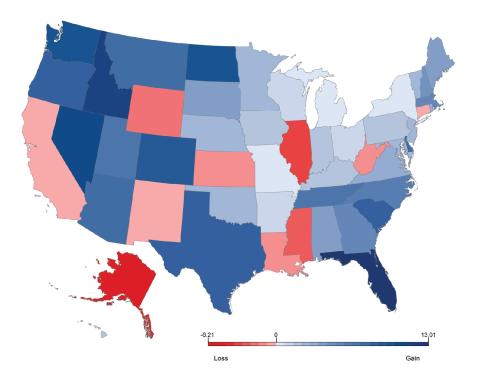
Source: Estimated from U.S. Census, 2010, 2020, and NCHS-CDC data. Analysis: K.M. Johnson, Carsey School, University of New Hampshire.
Fewer Births, Record High Deaths
Population gains amid migration losses, like those in California and six other states, occurred when births exceeded deaths by enough to offset the migration loss. Such natural change is the other demographic factor contributing to population change. Over the past decade, death rates reached record highs, while fertility rates hit record lows, resulting in more modest gains from natural change than in earlier decades. Despite declining births and rising deaths, all but two states—Maine and West Virginia—had more births than deaths during the decade. Maine had sufficient net migration to offset this natural loss and gain population overall. Natural gains were generally modest. Only Utah had a natural gain that exceeded 10 percent, 12 states had natural gains of between 5–10 percent, and 36 had natural gains of less than 5 percent (Figure 3).
Figure 3. Percent Natural Change, 2010 to 2020
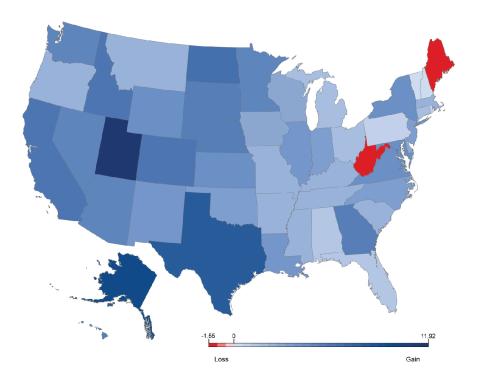
Source: Estimated from U.S. Census, 2010, 2020, and NCHS-CDC data. Analysis: K.M. Johnson, Carsey School, University of New Hampshire.
Population Change Depends on Both Migration and Natural Change
It is the combined impact of migration and natural change that causes population growth or decline. So, to understand the state population changes reflected in the new Census data, it is imperative to consider both the net movement of people into and out of each state as well as the balance between births and deaths there. Population gains exceeded 10 percent in 10 of the 11 states with both above-average natural change and net migration gain (Figure 4). In contrast, 15 of the 17 states that were below average on both natural change and migration had population losses or gains of less than 5 percent.
Looking ahead, the short-term prospects for substantial population increase appear limited. Even aside from the COVID-19-related deaths following the April 2020 Census, mortality is likely to rise among an aging U.S. population and the decline in births is ongoing. This leaves little likelihood of significant natural gain in the short term. Immigration also remains at a low ebb. How protracted the fertility decline and mortality increases will be or what the future prospects for immigration are remains to be seen, but they have already dramatically reduced population growth in the United States.
Figure 4. Natural Change and Net Migration Change By State, 2010 to 2020
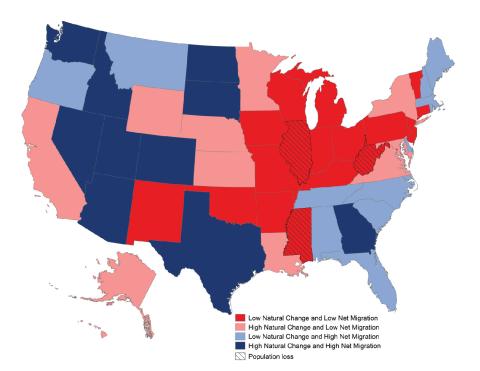
Source: Estimated from U.S. Census, 2010, 2020, and NCHS-CDC data. Analysis: K.M. Johnson, Carsey School, University of New Hampshire.
Methods and Data
Population data are from the 2020 and 2010 Census. Data on births and deaths to calculate natural change are from the National Center for Health Statistics. Births and deaths from January 1, 2020 to April 1, 2020 are estimated at 25 percent of the reported value for 2019. Births and deaths from April 1, 2010 to December 31, 2010 are estimated at 75 percent of the reported value for 2010. Net migration is calculated as the residual of population change minus natural change.