Since the COVID-19 pandemic hit the economy in March and April, every state has consistently seen highly elevated levels of Unemployment Insurance (UI) Claims. While the weekly numbers of initial claims have fallen dramatically from April's peak, over the past two months the national number of UI claims has plateaued at historic levels (please note that we are using non-seasonally adjusted data). The week ending October 17 saw a decrease nationally in initial unemployment insurance claims, although 12 states reported initial claims in excess of the previous week. Nationally, the weekly rate of initial UI claims has stagnated over the past 11 weeks, remaining fairly steady during August, September, and into October at levels near the worst weeks of the Great Recession. For the week ending October 17, Kansas and Massachusetts saw the largest increases in initial UI claims relative to their February labor forces, while Alaska and Georgia saw the largest declines compared to the previous week by the same measure.
The number of initial UI Claims filed is the most up-to-date measure of the extent of the employment loss across the country. It is, however, a gross measure—it reflects only those losing their jobs without being offset by those becoming employed. The distinction can be seen by comparing the UI claims data with employment data. While U.S. payroll employment was rising between March and September, UI claims remained at historically high levels. This coincidence of slowly rising employment and continued high levels of initial claims indicates an extremely volatile and fragile labor market with millions continuing to lose jobs while millions were being hired, as employers adapted to the many impacts of the COVID-19 crisis. As of September, the number of payroll jobs in the United States was still well below what they were in February, and since then millions of Americans have filed initial unemployment claims, indicating that these volatile conditions and widespread job losses have continued as the country has continued to fail to contain the disease.
One thing that has changed since claims began to rise in March is that we are now seeing initial claims by workers who were initially laid off, gained subsequent employment, and have been laid off again. These “repeat” initial claims are a further sign of the employment volatility in the economy.
Chart UI-1 shows the trend in UI initial claims for the country or selected state, district, or territory. After the huge numbers of initial claims in March and April there was a rapid decline as job losses continued at steadier, albeit historically high, levels. Over the past eleven weeks initial unemployment claims have been fairly stable for the United States as a whole after having fallen from a summer peak in mid-July—though the current level of initial claims remains nationally at or near peak Great Recession levels. Nearly every state has plateaued at historically high levels of initial UI claims. The most recent week for which data are available, October 17, did see a national decrease in initial claims over the previous week, although 12 states experienced claims exceeding the previous week. For comparison, the chart also shows the highest weeks of UI claims in 2008 and 2009 during the Great Recession.
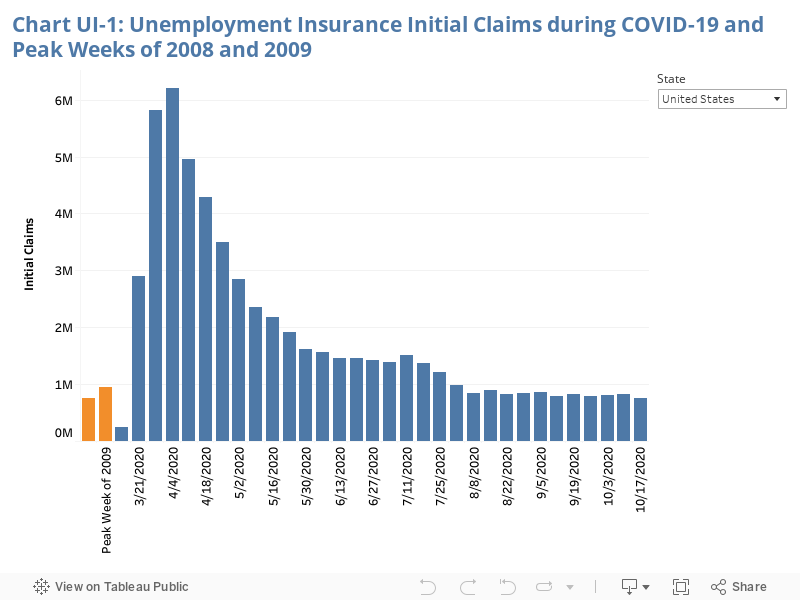
Unemployment Insurance Claims are not seasonally adjusted. Dates refer to the last day of the reporting week (e.g. 3/14/20 is the week of March 8 to March 14).
Every state in each of the last 31 weeks has seen claims well in excess of the claims it had before the recession hit in mid-March. In California, Hawaii, and the District of Columbia, initial unemployment claims have been higher than the worst weeks of the Great Recession in every single one of the past 31 weeks. Variation from week-to-week can reflect the pace at which claims are handled—states with systems that have a backlog are less likely to see a drop off even if there are fewer newly unemployed.
Table UI-1 has the sortable top-to-bottom listing of UI claims since September 13, March 8, and for selectable weeks since the week ending March 14. Differences between states in the number of claims filed are not a reliable indicator of differences between states in the numbers of jobs lost. In addition to the number of employees who have lost their jobs, differences can be attributable to differences in eligibility rules, filing ease, and states' efficiency in processing claims—particularly during the current unprecedented surge. Note also that when UI claims are summed over several months the count can include individuals more than once if they had filed an initial claim, become employed and lost their UI benefits, and then subsequently lose that job as well and file a new initial claim. The measure is of the number of claims filed not the number of people filing claims. The cumulative data presented in the table should be read with that in mind.
For a more detailed look at employment since the beginning of the pandemic, please visit COVID-19 Economic Crisis: By State.
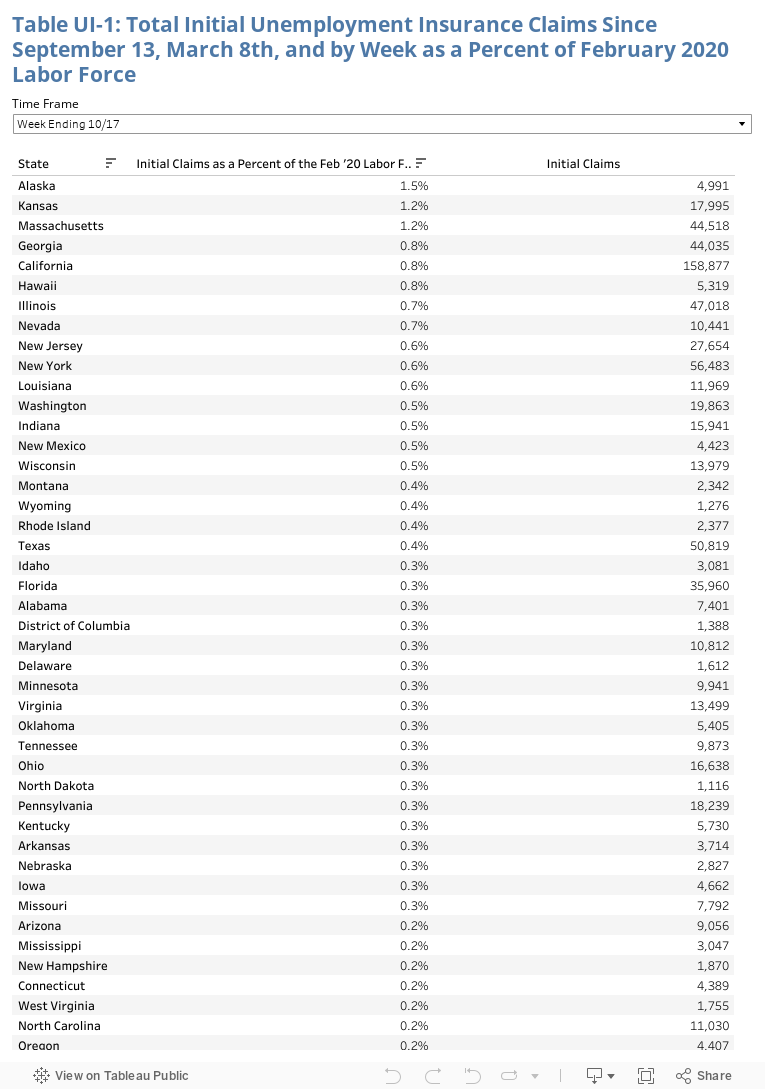
Table UI-1 shows, for each state, total initial UI claims (not seasonally adjusted) sortable by week since the week ending March 8, since September 13, and by individual weeks. The table also shows for those time periods total claims as a percent of the February labor force. It is sortable by the percent, total numbers, or state name.