Key Findings
New Hampshire families have not been exempted from the disruptions and challenges associated with an enduring pandemic, including disruptions to their children’s care and education arrangements, pressure on household budgets due to rising inflation, and new challenges of meeting children’s social, emotional, and physical needs amid persistent stressors and healthcare workforce shortages. The 2022 Preschool Development Grant’s (PDG) New Hampshire Family Needs Assessment Survey explored how New Hampshire families with children under age nine fare in accessing early childhood care and education, measured their knowledge and use of supportive programs, and identified new and enduring needs. Using survey responses from a non-random sample of parents statewide, this brief focuses on the use of programs to support families in caring for and educating their children.
Survey participants were asked about their level of familiarity with two sets of programs: one set to support their child’s learning and development and the second to help families get food. Nearly half (312 of 656) of respondents were using at least one of the programs under consideration, with the greatest program participation (125 respondents) in the National School Lunch or School Breakfast Program (“hot lunch”), followed by WIC (Women, Infants and Children’s Special Supplemental Nutrition Program) and Special Education, each with 101 respondents currently participating. The least-often used programs among respondents were summer meals and family home visiting, with only about 40 respondents reporting using each.
Along with current program participation, respondents were also asked to indicate prior participation and familiarity with different programs. Respondents were almost universally familiar with the group of food assistance programs, with between 96 and 97 percent of respondents having heard of SNAP (Supplemental Nutrition Assistance Program, or “food stamps”), WIC, food pantries, and school meals. Although findings are not directly comparable across sources, it is worth noting that these patterns of 90 to 100 percent familiarity with food assistance programs match findings from both the 2019–2020 and the 2020–2021 NH PDG needs assessments.1 The least-known program—summer meals—was still familiar to 83 percent of respondents, although familiarity varied with family income (see Figure 1). Importantly, however, the summer meals program was the only food program with which respondents were unevenly familiar: while more than 80 percent of respondents, in general, knew of summer meals, this dropped to only two-thirds among respondents in single adult households, who had often run out of food, or who had often worried about running out of food.
Figure 1. Percent of Respondents Familiar with Summer Meals Program by Family Income
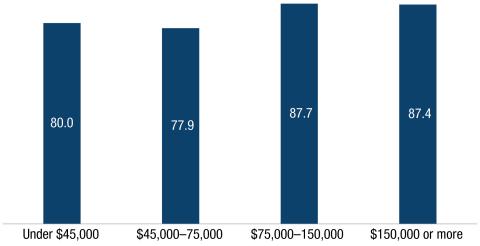
Source: UNH Carsey School analysis of 2022 NH PDG Family Needs Assessment Survey.
On the child development and education side, respondents showed mixed familiarity with programs. More than half had never heard of child care scholarships, similar to the share who had never heard of home visiting. More than one-third had never heard of family-centered early supports and services (FCESS). Findings from the two prior PDG needs assessments are remarkably similar—although not directly comparable—each also finding that around 40 percent of respondents were familiar with home visiting, around 65 to 70 percent were familiar with FCESS, and between half and two-thirds were familiar with child care scholarships.2 Special Education was by far the most familiar program, only asked in this most recent needs assessment survey, known to 556 respondents (88 percent). This is likely at least in part due to the sampling structure for this project, which leveraged connections through organizations serving families whose children have disabilities to reach respondents.
Figure 2. Percent of Respondents Who Have Heard of Child Development and Education Programs, By Age of Youngest Child
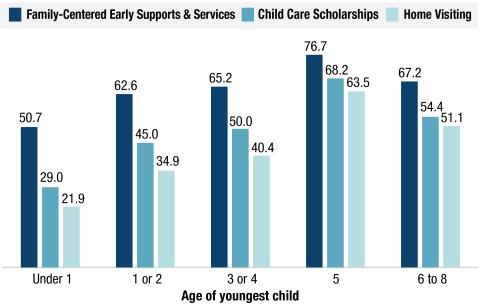
Note: Valid responses are 634 for home visiting, 635 for FCESS, and 636 for child care scholarships. Source: UNH Carsey School analysis of 2022 NH PDG Family Needs Assessment Survey.
Figure 3. Percent of Respondents Who Have Heard of Child Development and Education Programs, By Family Income
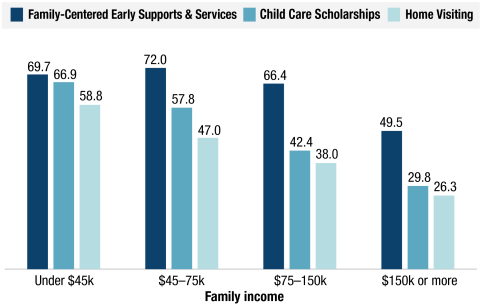
Note: Valid responses are 604 for FCESS and home visiting and 605 for child care scholarships. Source: UNH Carsey School analysis of 2022 NH PDG Family Needs Assessment Survey.
Perhaps because child development programs are only relevant during specific life stages, familiarity with these programs was not random. Respondents with older children were more familiar with child care scholarships, family-centered early supports and services, and home visiting (Figure 2), than those with younger children, who may have had fewer opportunities to seek and use these types of programs.3 This knowledge from exposure to services interpretation aligns with focus group findings from the 2019–2020 NH PDG needs assessment, which found that “families who were already engaged with the system—such as those with case workers, who were brought into the system through FCESS, who had children with complex medical needs, or who already used social services—reported having the most information.”4
Having heard of programs to support child development and education was also strongly linked to income, with lower-income respondents being more likely to have heard of FCESS, child care scholarships, and home visiting than their higher-income counterparts (Figure 3). While child care scholarships are only available to lower-income families, FCESS services are available to families based on family needs, regardless of income. Although the least well-known, home visiting services have the fewest eligibility requirements and are available to any interested parent from pregnancy through their child’s third birthday.5 Respondents were equally likely to have heard of special education across child age and income categories.
Along with program use and familiarity, respondents who did not participate in, but had heard of, SNAP or child care scholarship programs were also asked to indicate why. Among those who did not receive SNAP, half (264 of 532 respondents) reported that they did not think they were eligible. Since three-quarters of those respondents had incomes above $60,000 per year, it is likely that they were correct in that judgment, although that leaves at least one-quarter who might be eligible. One-third of non-SNAP-participating respondents (188 people) indicated that they didn’t need or want SNAP. Less than five percent of non-SNAP respondents said enrollment was difficult, or that they’d had a bad experience using SNAP benefits.
Among those who did not use child care scholarships, the most frequently selected reason was that the respondent did not think they were eligible (121 respondents). Two-thirds of those respondents had incomes above $60,000 a year, which likely places them above the income eligibility cutoff, although the remaining third might indeed be eligible. The second-most-often selected reason for nonuse of scholarships was “I don’t need or want it,” chosen by one in five respondents who do not participate. Reasons having to do with program enrollment barriers, like “enrolling was hard” or “I had a bad experience signing up” were selected by fewer than one in ten nonparticipants. This aligns with findings from the 2020–2021 needs assessment, which found “among low-income parents who were not currently receiving income support programs, very few reported that they did not apply because they did not know how or they had an unpleasant experience applying in the past.”6
Despite the uptake of key programs described above, participating families still reported an array of unmet needs. First, of the 668 parents asked, only 38 parents (5.7 percent) reported no areas in which additional programs would be helpful, while 248 (37.1 percent) reported one area, and 57.2 percent reported two or more.
Figure 4 shows the five areas in which the greatest number of respondents—at least one in five—indicated that additional support would be helpful. The most frequently selected area in which respondents would like more support was finding and paying for child care, followed by support for child development.
Figure 4. Top Five Areas in Which Respondents Reported Wanting Additional Support
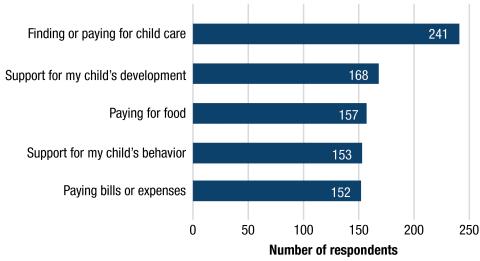
Note: Respondents could choose multiple options (n=668). Source: UNH Carsey School analysis of 2022 NH PDG Family Needs Assessment Survey.
While several questions on the survey allowed for write-in responses, this question elicited more responses than nearly any other write-in, with a substantial degree of diversity in responses, indicating the degree to which many respondents’ families are triaging child and family needs in a difficult pandemic-era context. In response to the list of areas for expanding potential programming (e.g., Figure 4), one respondent wrote, “All of these things are helpful, but I have just enough money to barely pay for most things.” Some respondents used the space to expand and underscore responses provided earlier—seven of 45 write-ins were about child care—while others shared novel ideas not listed elsewhere. The theme referenced by the greatest number of open-ended comments was the need to expand social opportunities for children and families. This need was voiced across the age spectrum, from “Mother baby or mother toddler play groups” for younger children to “more local and affordable after-school activities” for parents of older children. The 2020–2021 PDG needs assessment explicitly asked parents about interest in playgroups and found nearly half were interested; this is a service offered by many Family Resource Centers and perhaps offers an opportunity to engage parents missing this kind of programming.7
Beyond asking about additional programming, respondents were also asked two questions about having enough food at home, and one question about residential stability.8 Of the 649 respondents who answered at least one of these questions, 207 of them (31.8 percent) expressed some level of serious material hardship. Most of the hardship was food related, and 199 respondents reported that in the past 12 months, their household had at least sometimes run out of food before they had money to get more, or worried that they would. More than 40 respondents had moved to a temporary residence within the last 12 months when they couldn’t afford to pay rent or mortgage, and most of them (34 of the 42) had also struggled with food. In all, there was a core group of respondents who were struggling with real material hardships.
When respondents were asked “how do you find out about services and programs that might help your family?” several key sources emerged. The most-selected source was “family, friend, or neighbor,” cited by 317 of the 668 respondents (47 percent). Seeing trusted relationships as a resource for information sharing is a phenomenon established elsewhere too,9 and unsurprisingly, after family, friend, and neighbor, sources in second and third place were health care provider and child’s school or child care provider. Internet-based sources, like Google, social media, and state resources rounded out the list of resources selected by 20 percent of respondents or more (Figure 5). Both the sources and their rank order match the top three sites that parents identified as helpful sites for “resources” in a summer 2021 Dartmouth College study among parents of children under age nine in New Hampshire and Vermont’s Upper Valley region.10
Reliance on provider-based sources can be beneficial in targeting information to families but can also be complicated if medical and child care professionals are not up to date on program opportunities. The 2019–2020 PDG needs assessment, which also found a strong reliance on informal sources like friends and family, as well as on provider-based sources like doctors and early childhood educators, described their findings on the topic from key informant interviews: “Interviewees reported that the ability of pediatricians, child care organizations, and schools to share accurate information with families and to make helpful referrals depends, at least in part, on those groups networking with other service providers, which does not routinely happen.”11
Figure 5. Sources of Information on Programs That Might Help Children and Families, Reported by Respondents
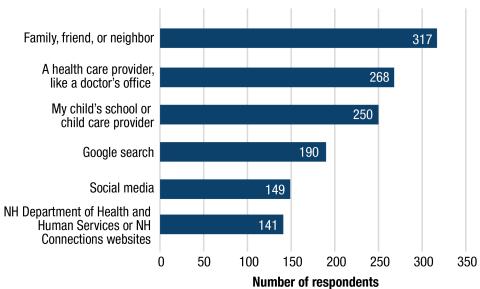
Note: Includes all sources mentioned as useful by at least 20 percent of respondents. Respondents could choose multiple options (n=668). Source: UNH Carsey School analysis of 2022 NH PDG Family Needs Assessment Survey.
That most of the respondents to this needs assessment had heard of at least some family support programs is encouraging, but the sharp division between knowledge about food and child development programs yields opportunities for more outreach. As across both child development and food support programs, respondents were most likely to not participate because they do not think they are eligible or do not want to participate suggests that outreach may require nuance. It is also encouraging that administrative barriers and negative participation experiences are not driving nonparticipation among respondents. Taken together, efforts to disseminate information about the existence of programs and their eligibility requirements might be the most helpful outreach to connect more families to supportive programs.
That respondents seek information from multiple sources also indicates an opportunity for outreach in multiple ways, and a caution to ensure good communication channels across professional networks. Beyond information sources, there is an increasing recognition that the informational medium matters, and that deploying a mix of in-person, virtual, text, social media, mail, individual, and group communications can support wider and deeper engagement. For instance, a recent Dartmouth College paper on engaging families with clinical and Family Resource Center services in the Upper Valley region has identified the importance of “continued and flexible communication,” with parents, engaging them through multiple methods.12
Given the nature of this survey, which uses a convenience sample and a relatively small sample size, it was not possible to analyze more challenges and program needs among more detailed subgroups of New Hampshire parents, such as parents of color. While other efforts in the state may help to fill these gaps, intentionally targeted efforts are required to understand how families with specific needs (including language, legal, educational, housing, or health care needs) might have responded differently to the questions here.13 In addition, many of the efforts required to reach specialized and general populations will require ongoing commitment: people move to New Hampshire, become parents, fall on hard times, or experience other family and life changes every day. Newly eligible people may not know what programs are available, or that they are eligible, so continued monitoring of program uptake and familiarity with programs through steady outreach efforts will be essential to ensure Granite Staters are connected to the services they need.
- See Lynn A. Karoly et al. 2020. “Understanding the New Hampshire Birth through Five System: A Needs Assessment.” RAND Corporation & the University of New Hampshire. https://chhs.unh.edu/sites/default/files/media/2021/06/nh_b-5_needs_assessment_pdg.pdf and National Center for Children in Poverty. 2021. “New Hampshire Preschool Development Grant Implementation Year Needs Assessment.” https://chhs.unh.edu/sites/default/files/media/2022/02/2020-21_nh_needs_assessment_final_report.pdf.
- Ibid.
- Although age of oldest child might give a clearer indication of how long respondents have been able to engage with child development programs, the survey focused on young children, and thus didn’t capture age ranges of respondents’ older children. Age of youngest child is collected in full for all respondents.
- P. 36 in Karoly et al. “Understanding the New Hampshire Birth through Five System: A Needs Assessment.”
- https://www.dhhs.nh.gov/sites/g/files/ehbemt476/files/documents/2021-11/hfa-rack.pdf.
- National Center for Children in Poverty. “New Hampshire Preschool Development Grant Implementation Year Needs Assessment.”
- Ibid.
- The two food questions were the Hunger Vital SignTM, a validated two-question food insecurity screener that identifies households as being at risk for food insecurity. See more about that measure here: https://childrenshealthwatch.org/public-policy/hunger-vital-sign/.
- For instance, word-of-mouth has been found effective as a research recruitment strategy among low income populations, and as a strategy employed by low-income adults seeking support with material hardships. For an example of the former, see Olga A. Khavjou, Patrick Turner, and Deborah J. Jones. 2018. “Cost Effectiveness of Strategies for Recruiting Low-Income Families for Behavioral Parent Training.” Journal of Child and Family Studies 27(6): 1950–1956. https://doi.org/10.1007/s10826-017-0997-9. For an example of the latter, see Vicki Lens, Margo Nugent, and Chris Wimer. 2018. “Asking for Help: A qualitative Study of Barriers to Help Seeking in the Private Sector.” Journal for the Society of Social Work and Research 9(1):107–130. https://doi.org/10.1086/696356.
- See p. 21 in “COVID Parent Survey Results.” 2021. Hanover, NH: Project LAUNCH Upper Valley Center for Program Design & Evaluation, Dartmouth College.
- P. 36 in Karoly et al. “Understanding the New Hampshire Birth through Five System: A Needs Assessment.”
- See Erin Knight-Zhang, Katy Merriweather, and Hannah Haskell. 2022. “COVID Impact Interviews: Summary & Key Findings.” Hanover, NH: Project LAUNCH Upper Valley Center for Program Design & Evaluation, Dartmouth College.
- An ongoing effort from New Hampshire’s Endowment for Health is making important contributions to this space through its Early Childhood Equity Movement work. This effort, in partnership with New Hampshire residents and research organization Child Trends, is focused on improving access to family- and child-supporting services for racially and culturally diverse Granite Staters. The first report from this work was released in January 2023. See Manica F. Ramos, Kristine Andrews, Joselyn Angeles-Figueroa, and Yosmary Rodriguez. 2023. “Seven New Hampshire Communities Lead the Way Toward Improved Equity in Family Services.” Bethesda, MD: Child Trends. https://www.childtrends.org/publications/seven-new-hampshire-communities-lead-the-way-toward-improved-equity-in-family-services.
The authors are incredibly thankful to all the New Hampshire parents who took the time to participate in this survey and share details about their families with us. This work would not have been possible without Robin deAlmeida and Michelle Lewis and their teams at the Parent Information Center/New Hampshire Family Voices, who tirelessly spearheaded sample recruitment. Additional thanks to Zach Azem and Tracy Keirns at the UNH Survey Center for their support and speed in ensuring data quality; Carrie Portrie and Kamala Nasirova at the Carsey School for research support; Laurel Lloyd and Bailey Schott at Carsey for layout and communications expertise; the state employees and nonprofit partners who offered expert insight into the survey instrument; and the PDG Leadership Team for their thought partnership across the project.

Sarah Boege, MPP, is a senior policy analyst with the Center for Social Policy in Practice at the Carsey School of Public Policy. Sarah supports Carsey research through data collection and analysis, GIS mapping, and translating and disseminating research findings. At the core of their past and current work is the use of research to inform more equitable and accessible policy, practice, and decision-making.

Jess Carson, PhD, is the director of the Center for Social Policy in Practice and a research assistant professor at the University of New Hampshire’s Carsey School of Public Policy. Jess studies how policy affects people, focusing on how legislative and administrative decisions shape access to resources available through work, the social safety net, and community settings.
ABOUT THE 2022 NEW HAMPSHIRE PRESCHOOL DEVELOPMENT GRANT FAMILY NEEDS ASSESSMENT SURVEY
What was the survey?
The 2022 New Hampshire Preschool Development Grant (PDG) Family Needs Assessment Survey. The goal of the survey was to collect information on family well-being, family needs, social service program experience, and remaining needs facing New Hampshire families with children under the age of 9.
Who was invited?
To be eligible to participate in this survey, respondents had to be at least 18 years old, be the parent or guardian of one or more children under age 9, and live in New Hampshire year-round or be a seasonal resident who is registered to vote in New Hampshire. Parents were invited to participate in two different phases. In Phase 1, the UNH Survey Center contacted their existing panel of New Hampshire residents that participate in regular text-to-web surveys (known as the Granite State Panel). In Phase 2, the Parent Information Center (PIC)—a nonprofit family-focused agency—tapped their statewide network of family-serving agencies to invite eligible parents to participate. This second phase resulted in a convenience sample, meaning respondents recruited through partner networks were not randomly selected to participate.
PIC disseminated “open” survey links (that anyone could click and open) among their networks. Unfortunately, the accessible links were infiltrated by fraudulent respondents quickly, with some gathering hundreds of illegitimate responses per hour. Each time a link was compromised it was closed, a new link was created, and recruitment materials (i.e., flyers) were updated accordingly and re-distributed to partners. Fraudulent and nonhuman (“bot”) respondents were anticipated, and an extensive screening process was employed by Carsey researchers to endeavor to distinguish eligible respondents from fraudulent ones. The next round of outreach from PIC took a very grassroots approach to avoid strategies that led to compromised links (such as email blasts, electronic newsletters, or using social media to advertise the study). PIC staff individually called over 500 organizations that serve families with young children, explicitly stating that groups could only share the survey with families via email or text. PIC then shared the survey materials via email with the contacts we reached, again noting the restrictions in bold. PIC staff posted survey fliers in locations that families with young children frequent, such as the children’s section of bookstores, and staffed events such as back-to-school nights to hand out flyers to families in attendance. Thanks to PIC’s dedication and intentional outreach, fraudulent responses were a non-issue in this second round of survey recruitment.
Who participated?
From the Granite State Panel, 127 eligible parents participated. Through more general recruitment via PIC, an additional 541 eligible parents participated in the survey. Thus, this brief includes data from a total of 668 respondents. The distribution of respondents across the state is shown in the map.
Map of Respondents to the 2022 New Hampshire Preschool Development Grant Family Needs Assessment Survey
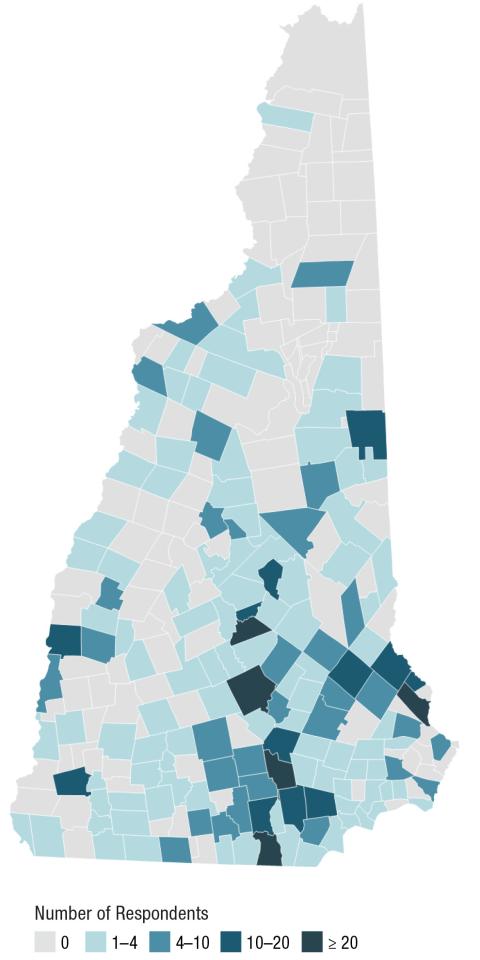
Source: UNH Carsey School analysis of 2022 NH PDG Family Needs Assessment Survey.
What did participants do?
Participants were asked to complete a one-time online survey about their use of child care, social support programs, child development concerns, employment, and any medical, physical, behavioral, and mental health needs of their children. To inform the early childhood systems work of the Preschool Development Grant, this survey was developed in partnership with the New Hampshire Department of Health and Human Services, the New Hampshire Department of Education, the Preschool Development Grant Leadership team, the UNH Survey Center, and the UNH Carsey School of Public Policy. The survey took a median of 11 minutes to complete, and respondents who were not part of the Granite State Panel (n=127) were offered a $10 Amazon gift card for their participation. Participants were surveyed between July 13 and October 4, 2022.
Are these data representative of New Hampshire parents?
It depends. The parents reached in Phase 1 by the UNH Survey Center (n=127) are part of a panel designed to yield a representative sample. However, the sample reached in Phase 2 via local partners was not part of a random sample and thus is not representative. Because it was not possible to know how many New Hampshire residents with a child under age nine received the invitation to participate, we cannot estimate a response rate to Phase 2 of this survey. For Phase 1, 21 percent of the selected sample completed the survey; however, half of those respondents did not have children in the proper age range, resulting in 11 percent of the initially contacted sample being both in-universe and completing the survey. Therefore, this brief describes findings as among “respondents” rather than all parents. However, this sample does match the characteristics of New Hampshire parents of children under age nine derived from U.S. Census Bureau data on several dimensions, including the distribution of child age, employment status, race-ethnicity, and language is spoken. The sample is slightly younger, more educated, and more often rural than New Hampshire parents overall. Although not representative of parents statewide, results here can shed light on some of the skills, resources, and needs that are relevant to at least a portion of this population.
This opportunity is funded by NH’s Preschool Development Grant, sponsored by the U.S. Department of Health and Human Services, Administration for Children and Families (Award# 90TP0060). Any opinions, findings, conclusions, or recommendations expressed in this publication do not necessarily reflect the views of any organization or agency that provided support for the project.