download the brief
Key Findings

Greenspace conversions to developed land are most common in areas where greenspace is already limited.
Population density strongly influences the conversion of greenspace to development, but it is not the only factor: population growth, the initial prevalence of greenspace, and the area’s recreational or retirement appeal are important as well.

Conversions are most likely to occur on the urban periphery and in high-amenity rural areas.
An ongoing concern in both urban and rural America is the tradeoff between residential and commercial development and the conservation of forestland, shrublands, and grasslands, commonly referred to as greenspace. As communities develop, adding schools, housing, infrastructure, and the commercial space needed for an expanding population and economy, greenspace remains critical because it contributes to air and water purification, storm abatement, and enhanced human health and quality of life. The tension between development and maintaining greenspace is greatest where human populations are densely settled and expanding, and the concern is of particular relevance because the transformation tends to be permanent—developed land rarely reverts to greenspace.
This brief contributes to a better understanding of the linkages between demographic and land-cover change and provides facts that can inform policy aimed at balancing development and greenspace conservation.
Greenspace and Development in the Great Lakes Region
The research summarized here1 combines demographic, land-cover, and other spatial data to estimate the incidence and extent of conversion from greenspace to development in the Great Lakes states (Illinois, Indiana, Michigan, Minnesota, Ohio, and Wisconsin). Greenspace is abundant in the Great Lakes region (Figure 1), an area that contains 9 percent of the nation’s land area and 16 percent of its population. Most of this population (81 percent) resides in metropolitan areas, but most of the land area is rural (66 percent). Regional demographic trends range from widespread population loss in urban cores and in agricultural and forested areas to extensive population growth on the urban periphery and in scattered rural areas, particularly those proximate to lakes and natural amenities.
The Great Lakes region has a diverse mix of land covers and land uses, including dense urban cores, sprawling suburbs, farmland, forests, and lake-based recreational areas. Exceptionally fertile soils result in productive agricultural land in much of the central and southern parts of the region, while greenspace, including substantial stands of high-quality timber, characterize much of the northern part. In total, 40 percent of the region’s land is agricultural, 39 percent is greenspace, and 10 percent is developed. Agriculture, timber, and recreation are all critical to economic well-being in rural areas of the region.2
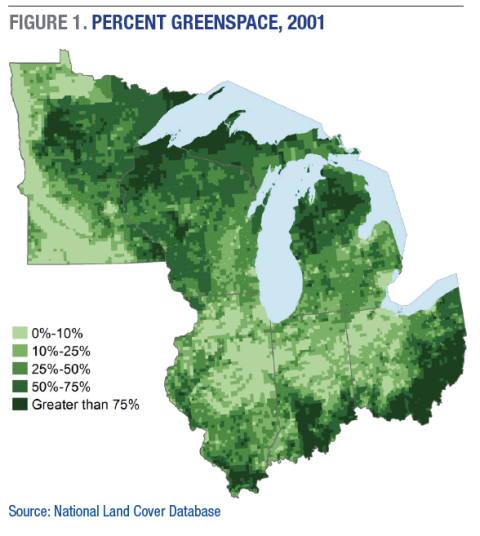
The vast stretches of greenspace are a significant resource to both nearby and distant populations. It is abundant in the forests of northern Michigan, Wisconsin, and Minnesota, in the Appalachian foothills of eastern Ohio, and in far southern Indiana and Illinois, but it is limited in the rich agricultural belt spanning the middle of Ohio, Indiana, Illinois, and western Minnesota.
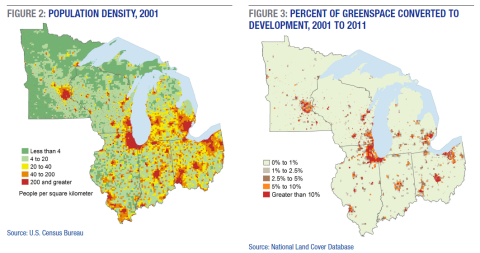
Population density varies dramatically within the Great Lakes region, from large, sprawling urban areas to vast, sparsely settled stretches in the north woods and the agricultural heartland (Figure 2). In the region’s 10,579 subareas defined by the Census Bureau, population density varies from more than 200 people per square kilometer (km2) in 18 percent of the subareas to less than 20 per km2 in over 50 percent. Most of the thinly settled areas are in the forest regions of northern Michigan, Wisconsin, and Minnesota but also in agricultural areas of central Illinois, Ohio, and Indiana.
Nearly 1,500 km2 of greenspace, spatially concentrated in urban and suburban areas, were converted to developed land between 2001 and 2011 (Figure 3). Nine percent of the region’s subareas had at least 5 percent of their greenspace converted to developed land, while nearly 83 percent experienced little if any conversion. Though there was a significant loss of greenspace to development, the vast majority of land in the Great Lakes region did not undergo land-cover conversion: almost 99 percent of the region remained in the same land-cover type in 2011 as in 2001.
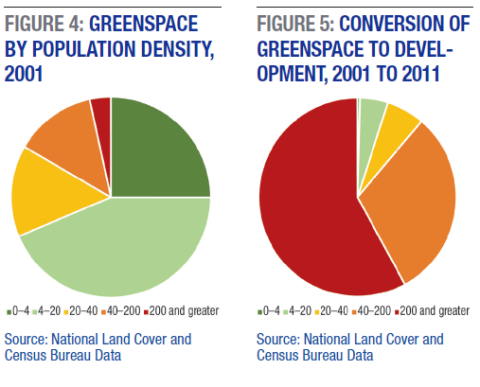
Most greenspace in the Great Lakes region—69 percent—is concentrated in subareas with fewer than 20 people per km2 (Figure 4). In contrast, less than 3 percent of the greenspace is in subareas with population densities above 200 per km2, and another 13 percent is in subareas with a population density of 40–200 people per km2.
Conversions from greenspace to development were most common on the periphery of densely settled metropolitan areas. Though these areas contained just 3.4 percent of the region’s greenspace, 58 percent of conversions occurred there (Figure 5); an additional 31 percent of the conversions occurred in moderately dense subareas (40–200 persons per km2) that contained 13 percent of the greenspace. Most of these conversions were on the urban edge or just beyond the urban periphery. However, some conversions occurred in amenity-rich rural areas, such as near Traverse City, Michigan, on the shore of Lake Michigan. In contrast, only 5 percent of the conversions occurred in the two least densely settled categories of subareas (fewer than 20 persons per km2), even though these areas contained 69 percent of the region’s greenspace. With a few exceptions, conversion was far less common in northern Wisconsin, Michigan, and Minnesota and in the agricultural belt of Illinois, Indiana, and Ohio than in more densely settled areas.
We have emphasized here the linkage between population density and the conversion of greenspace to developed land. However, population density is not the only factor influencing the conversion of greenspace to development. In our statistical models, population growth, the initial prevalence of greenspace, and the area’s recreational or retirement appeal all consistently influenced the likelihood of conversion. Other factors, including housing density, proximity to a major highway, and position along the urban-rural continuum, were influential under some circumstances. Though our statistical models did well at predicting the general areas in which greenspace-to-development conversion was likely, we concluded that local expertise regarding an area’s history, social conditions, economics, and land use would likely improve the utility of our models for policy making.3
The Implications of Greenspace Conversion for Policy
Our analysis combining demographic, land cover, and other data suggests that the stress on natural ecosystems fostered by development in the Great Lakes region is likely to be greatest in and around urban areas, but selected rural areas, such as recreational or retirement destinations, may also be stressed. Prior research suggests that when greenspace is converted to development, the functionality of ecosystem services is diminished because of the expense and limited availability of engineered solutions, such as wastewater treatment plants.4 This problem is particularly acute in rural areas, where infrastructure funds are limited. But, densely populated areas are at risk as well, because greenspace is already minimal there and further losses may disproportionately impact remaining locally derived ecosystem services.? By enhancing our understanding of where future changes are most probable, this research informs planning and policymaking directed toward reducing the impact of development on resource production, environmental health, and ecosystem services.
Methods
The units of analysis for this study are the 10,579 county minor civil divisions (MCD) in the Great Lakes states delineated by the U.S. Census Bureau. County townships, which are the basis for most of the MCDs, were originally delineated as 6 miles (9.65 km) on a side. Further divisions occurred in some states as urbanization proceeded, but many of the original 6-by-6-mile townships remain. We used the latest longitudinally compatible data that provided comprehensive information at the spatial scale required to analyze MCDs. Land-cover data are from the National Land Cover Database (NLCD) for 2001 and 2011.? The NLCD data were originally collected for 30 meter pixels, but we aggregated them to MCDs. We combined the NLCD grassland/herbaceous, shrub, and forest subcategories to produce our greenspace category. The population data are from the 2000 and 2010 U.S. Decennial Censuses. Details of the data and methods and more comprehensive analytical results are available in the article that is the basis for this brief.7
Endnotes
1. This brief summarizes and extends the research in M.J. Ducey, K.M. Johnson, E.P. Belair, and B.D. Cook, “The Influence of Human Demography on Land Cover Change in the Great Lakes States, USA,” Environmental Management (2018), doi.org/10.1007/s00267-018-1102-x.
2. Stephen R. Shifley and W. Keith Moser, eds., “Future Forests of the Northern United States,” Gen. Tech. Rep. NRS-151 (Newtown Square, PA: U.S. Department of Agriculture, Forest Service, Northern Research Station, 2016); L.M. Brander and M.J. Koetse, “The Value of Urban Open Space: Meta-Analyses of Contingent Valuation and Hedonic Pricing Results,” Journal of Environmental Management 92 (2011): 2763–73.
3. Ducey, Johnson, Belair, and Cook (2018).
4. R. Costanza, R. d’Arge, R. De Groot, S. Farber, M. Grasso, B. Hannon, K. Limburg, S. Naeem, R.V. O’Neill, J. Paruelo, and R.G. Raskin, “The Value of the World’s Ecosystem Services and Natural Capital,” Ecological Economics 25 (1998): 3–16; D. Foster, J. Aber, C. Cogbill, C. Hart, E. Colburn, A. D’Amato, B. Donahue, C. Driscoll, A. Ellison, T. Fahey, and B. Hall, “Wildlands and Woodlands: A Vision for the New England Landscape” (Petersham, MA: Harvard Forest, Harvard University, 2010).
5. K. Bagstad, F. Villa, D. Batker, J. Harrison-Cox, B. Voigt, and G. Johnson, “From Theoretical to Actual Ecosystem Services: Mapping Beneficiaries and Spatial Flows in Ecosystem Service Assessments,” Ecology and Society 19 (2014): 64–78; D.J. Nowak, S. Hirabayashi, A. Bodine, and E. Greenfield, “Tree and Forest Effects on Air Quality and Human Health in the United States,” Environmental Pollution 193 (2014): 119–29; R. Russell, A.D. Guerry, P. Balvanera, R.K. Gould, X. Basurto, K.M. Chan, S. Klain, J. Levine, and J. Tam, “Humans and Nature: How Knowing and Experiencing Nature Affect Well-Being,” Annual Review of Environment and Resources 38 (2013): 473–502; S.R. Shifley, W.K. Moser, D.J. Nowak, P.D. Miles, B.J. Butler, F.X. Aguilar, R.D. DeSantis, and E.J. Greenfield, “Five Anthropogenic Factors That Will Radically Alter Forest Conditions and Management Needs in the Northern United States,” Forest Science 60, no. 5 (2014): 914–25.
6. C.G. Homer, J.A. Dewitz, L. Yang, S. Jin, P. Danielson, G. Xian, J. Coulston, N.D. Herold, J.D. Wickham, and K. Megown, “Completion of the 2011 National Land Cover Database for the Conterminous United States: Representing a Decade of Land Cover Change Information,” Photogrammetric Engineering and Remote Sensing 81, no. 5 (2015): 345–54.
7. Ducey, Johnson, Belair, and Cook (2018).
Acknowledgments
This research was supported by the project, “Demographic Transformation in the Forested Regions of Nonmetropolitan America: Implications for Carbon Sequestration, Forest Harvesting and Ecosystem Services,” a research joint venture (14-JV-11242309080) of the U.S. Department of Agriculture Forest Service’s Northern Research Station and the University of New Hampshire. The content is solely the responsibility of the authors and does not necessarily represent the official views of the USDA Forest Service.