Key Findings
New Hampshire families have not been exempt from the disruptions and challenges associated with an enduring pandemic, including disruptions to their children’s care and education arrangements, pressure on household budgets due to rising inflation, and challenges of meeting children’s emergent social, emotional, and physical needs amid persistent stressors. The 2022 New Hampshire Preschool Development Grant’s (PDG) Family Needs Assessment Survey explored how New Hampshire families with children under age nine fare in accessing early childhood care and education, measured their knowledge and use of supportive programs, and identified new and enduring needs. Using survey responses from a non-random sample of parents statewide, this brief focuses on early childhood care and education, a sector for which the pandemic exacerbated long-simmering challenges.
About three-quarters of respondents with children under age five had searched for a new child care arrangement in the past year, with deeply divided experiences. Of the more than 300 searching parents, 52 percent reported their search was difficult, while the rest reported it was not. Having a difficult experience was not related to respondents’ geographic characteristics, such as whether the respondent lived in a rural part of the state or in one region over another, to family characteristics, like the number of adults in the house, income, or employment, or to the age of the respondents’ youngest child.
Rather, regardless of these characteristics, respondents most often struggled with the availability and affordability of slots (Figure 1). “Options are too expensive or are full, with extensive wait lists,” explained one parent. Others concurred, suggesting that “limited openings” resulted in “very long waitlist[s] and few options.”
Figure 1. Frequency of Challenges Among Respondents Reporting Search for Child Care Was Difficult
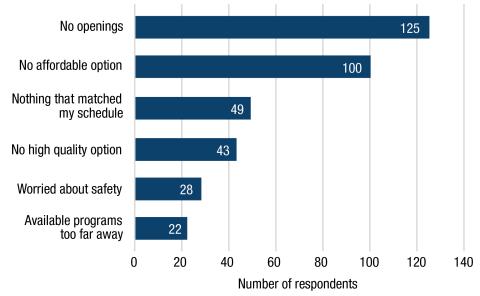
Note: Figure includes responses from the 164 respondents who searched for child care in prior 12 months and reported “it was difficult.” Respondents could select more than one option. Source: UNH Carsey School analysis of 2022 NH PDG Family Needs Assessment Survey.
That respondents felt limited openings so acutely is likely exacerbated by a combination of factors. First, while many states saw their child care supply decimated by the pandemic,1 the number of licensed slots in New Hampshire slightly rose between 2017 and 2021.2 However, New Hampshire is also part of a broader national trend toward the loss of licensed family or home-based providers. As a result, although New Hampshire’s overall supply has weathered the pandemic well, available slots have consolidated into fewer locations,3 which could result in parents’ perception of “no openings” among providers near enough to be feasible options for care. While data collected in prior PDG needs assessments are not directly comparable to the data here, it is worth noting that affordability was more often cited as a difficulty in the 2019–2020 assessment than was a lack of openings.4 By the 2020–2021 needs assessment, the two were more similarly ranked.5 In this assessment, a lack of “openings” eclipsed affordability as a factor, despite other difficulties remaining similarly ranked over time (e.g., about one-third of respondents in each of the three assessments have struggled to find care that matches their schedule).
Despite challenges while seeking care, three-quarters of those who sought care in the past year reported eventually finding it. As a result, 74 percent of all respondents with children under age five reported using at least five hours per week of nonparental care. This share matches estimates from Census Bureau data collected in fall 2022, which show 76 percent of New Hampshire households with a child under age five used some form of child care in the past week, higher than the 64 percent nationwide.6
Two-thirds of respondents here used only licensed care, while the remainder were roughly split between using unlicensed care only (mostly relative care) and a mix of licensed and unlicensed care. Figure 2 shows the prevalence of specific arrangements, with licensed center-based care emerging as the most selected option among respondents here. Because respondents could select multiple options, comparison with other sources is complicated, although the U.S. Department of Education also finds center-based care (including public preschool, in their measure) as the most popular nonparental arrangement for children not yet in school, also followed by relative care, then licensed family home care, matching the rank order here.7
Figure 2. Care Arrangements among Respondents with Children Under Age Five
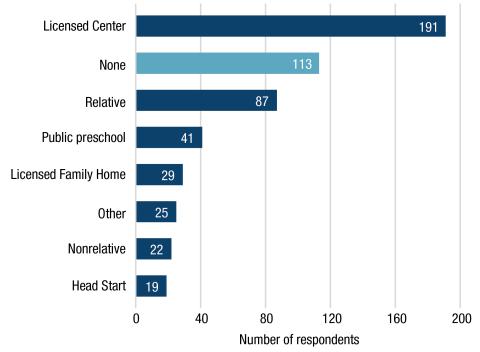
Note: Respondents could select more than one option. Figure includes responses from 306 of the 316 respondents who use at least some nonparental care for their child(ren) under age five. Public preschool includes 9 respondents whose children are enrolled in preschool special education. “Other” includes a mix of write-in responses, including “private preschool,” “unlicensed,” and “nanny.” Source: UNH Carsey School analysis of 2022 NH PDG Family Needs Assessment Survey.
Although most respondents with children under five had access to care, about four-fifths of those using care reported that the arrangement was less than ideal (249 of 316 respondents). Interestingly, the share of respondents who said their current arrangement “works well” or “is ideal” varies according to the type of care that respondents use, as shown in Figure 3, with respondents who use only licensed care expressing the highest level of satisfaction. It is possible that licensed care settings are more often equipped with the staff and infrastructure to offer longer hours, fewer closures, or the type of quality that respondents seek.
When asked to select from a list of 15 possible ways8 that their child care situation might be improved, only two options were selected by more than 20 percent of those in less-than-ideal child care situations: 61 said child care would be improved by less staff turnover and 149 said it would help if arrangements were more affordable (out of 249 respondents). That respondents expressed such a mixed set of opinions on how to improve child care underscores the diversity of family needs in crafting an ideal child care scenario.
Although this survey did not collect child care arrangements separately for each child in the household, examining respondents’ reported care arrangements by the age of their youngest child suggests that patterns of child care use here match general patterns of lower nonparental care rates among families with infants, and higher use among families with older pre-school-aged children.9
Figure 3. Percent of Respondents Who Say Their Young Child(ren)’s Current Care Arrangement Is “Ideal” or “Working Well,” by Type of Care Used
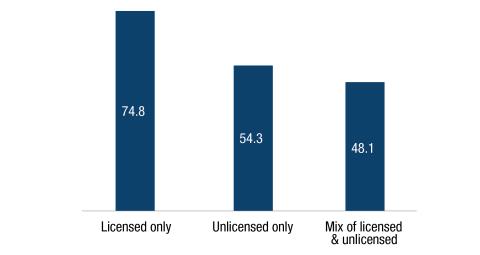
Note: Figure includes responses from the 316 respondents who have children under age five and who use at least some nonparental care. Source: UNH Carsey School analysis of 2022 NH PDG Family Needs Assessment Survey.
xxx
Respondents who have children under age five but do not use care (113 respondents), offered an array of explanations as to why. As shown in Figure 4, the most popular response was that the family preferred parental care only. However, the second most often selected option was “I can’t afford it,” which suggests at least some degree of unmet demand among respondents. One parent explicitly noted, “We’ve made the choice that I will stay home since daycare cost[s] would take up a significant portion of any paycheck I’d receive.” Indeed, when asked whether they would use some early care and education option if it were affordable, easily accessible, and matched their family’s schedule, two-thirds of respondents who didn’t use care said they would be at least somewhat likely to enroll (75 respondents). Other respondents expressed a diverse set of barriers to child care use, including subsidy-related barriers (“Child care director said she loses money by accepting the state scholarship, so my daughter was disenrolled from the program”) and challenges with finding the right behavioral fit (“Child was expelled from two preschools and now I stay home with him while we wait for a spot at [specific center name]”).
Figure 4. Top Five Reasons for Not Using Early Care and Education, Among Respondents with Child(ren) Under Age Five Who Do Not Use Care
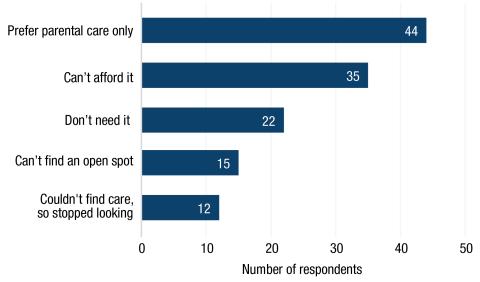
Note: Respondents could select more than one option. Figure includes responses from 113 respondents who do not use care. Source: UNH Carsey School analysis of 2022 NH PDG Family Needs Assessment Survey.
The prior sections focus on the care arrangements of children under age five, yet respondents with children aged five through eight often need child care too. Most respondents reported that their children ages five through eight attended public, private, or charter school, although a small handful of respondents reported homeschooling their child(ren). Respondents identified a need for child care support to cover the gap between the duration of a typical school day and year, and a parental work schedule. Out of a total of 395 respondents with school-aged child(ren), between 80 and 100 reported using before- or after-school care in a town recreation program, a summer camp or summer recreation program, or care from a person related to the child.
While a slightly higher share of respondents with older children reported that their care arrangement was ideal (28 percent) than among those with younger children (20 percent), respondents still indicated considerable areas for improvement. Of the 280 respondents reporting “less than ideal” care arrangements, 109 (39 percent) said making the arrangement more affordable would be an improvement. The next-most popular response was “offered more individualized attention to each child,” noted by 63 respondents. Finally, 52 respondents suggested that being open for different or longer hours would improve their school-aged child(ren)’s care arrangement. Scheduling laments came in a range of issues. Twenty-eight respondents reported wanting evening or weekend care. Several respondents reported wanting “more options for after-school care,” while others noted, “nothing opens early enough.” Others suggested affordable summer camp options were limited. In sum, one parent wished “school operated on a schedule that matched most working parents.”
That three-quarters of respondents had searched for child care in the past 12 months was surprising. Whether this is due to pandemic-related care disruptions or a failure of current arrangements to meet family needs, the rate of searching among respondents here is substantially higher than national rates estimated long before the pandemic, which suggested that less than half of families with a child under age six had searched for care in the past two years.10
The consistency of child care openings and affordability remaining a challenge is unsurprising. Families consider a variety of factors in selecting a child care arrangement and often must make tradeoffs when their options are limited or constrained. In fact, a 2022 study from the Federal Reserve Bank of Boston found that even when parents engaged in extensive child care searches, they were still forced to make tradeoffs.11 Given the realities of the United States’ mostly private child care market, the Boston Fed study describes access to formal licensed care as dependent on a family’s financial means or the ability to take advantage of limited child care subsidies. Although child care subsidies are a key existing mechanism for supporting families, only 19 percent of all respondents here had ever used a NH child care scholarship, and only 9 percent currently did. Improving take-up of, and considering expansions, this program represents one way to support New Hampshire families’ access to high-quality child care. Other impending efforts in the state, including proposed workforce-supporting legislation, a new strategic plan for early childhood, the implementation of a new Quality Recognition and Improvement System, and the deployment of discretionary dollars from the American Rescue Plan Act offer additional opportunities to strengthen the state’s early childhood care and education infrastructure.
- For instance, see Pete Nabozny, Agabek Kabdullin, and Shannon Mullin. 2022. “Rebuilding Our Future: Child Care Closures in New York During the Pandemic.” The Children’s Agenda. https://thechildrensagenda.org/wp-content/uploads/2022/08/Child-Care-Closures-Report-FINAL.pdf.
- Authors’ own analysis of data from the New Hampshire Department of Health and Human Services Child Care Licensing Unit. Available upon request.
- For instance, between summer 2017 and summer 2021, the state went from 741 licensed providers who served children under age five to 679 providers, a loss that was realized at an accelerated pace among family or home-based providers. In the same period, the number of providers licensed for fewer than 10 slots shrunk by 31 percent, while the share offering 100 slots or more rose by 28 percent. Authors’ own analysis of data from the New Hampshire Department of Health and Human Services Child Care Licensing Unit. Available upon request.
- Lynn A. Karoly et al. 2020. “Understanding the New Hampshire Birth through Five System: A Needs Assessment.” RAND Corporation & the University of New Hampshire. https://chhs.unh.edu/sites/default/files/media/2021/06/nh_b-5_needs_assessment_pdg.pdf.
- National Center for Children in Poverty. 2021. “New Hampshire Preschool Development Grant Implementation Year Needs Assessment.” https://chhs.unh.edu/sites/default/files/media/2022/02/2020-21_nh_needs_assessment_final_report.pdf.
- Authors’ analysis of data from the U.S. Census Bureau, Household Pulse Survey, Phase 3.6, Weeks 49–51. Estimates are derived using household-level replicate weights.
- National Center for Education Statistics. 2022. “Early Childhood Care and Education Programs in Rural Areas.” Condition of Education. U.S. Department of Education, Institute of Education Sciences. Retrieved November 2022 from https://nces.ed.gov/programs/coe/indicator/lca.
- The full list of possible responses that might improve the child care arrangement includes: was more affordable, accepted state child care scholarships, was a different kind of setting (center, school, home, etc.), was open nights and weekends, had more bilingual options or supports for English language learners, focused more on health and safety, had better quality caregivers or teachers, had less staff turnover, was closer to my work or school, was closer to my home, had more diversity among children and teachers, focused more on academics, offered more individualized attention to each child, don’t know, other (please specify).
- See, for instance, Jiashan Cui, Luke Natzke, and Sarah Grady. 2021. “National Household Surveys Program: First Look at Early Childhood Program Participation 2019.” NCES 2020-075REV National Center for Education Statistics, U.S. Department of Education. https://nces.ed.gov/pubsearch/pubsinfo.asp?pubid=2020075REV.
- Patti Banghart. 2022. “Factors that Influence Families’ Search for Child Care and Early Education.” OPRE Report #2022-70. Washington, DC: Child Care and Early Education Policy and Research Analysis, Office of Planning, Research, and Evaluation, Administration for Children and Families, U.S. Department of Health and Human Services.
- Sarah Savage and Wendy Robeson. 2022. “Child Care Tradeoffs Among Massachusetts Mothers.” Community Development Issue Brief 2022-3. Boston, MA: Federal Reserve Bank of Boston. https://www.bostonfed.org/publications/community-development-issue-briefs/2022/child-care-tradeoffs-among-massachusetts-mothers.
The authors are incredibly thankful to all the New Hampshire parents who took the time to participate in this survey and share details about their families with us. This work would not have been possible without Robin deAlmeida and Michelle Lewis and their teams at the Parent Information Center/New Hampshire Family Voices, who tirelessly spearheaded sample recruitment. Additional thanks to Zach Azem and Tracy Keirns at the UNH Survey Center for their support and speed in ensuring data quality; Carrie Portrie and Kamala Nasirova at the Carsey School for research support; Laurel Lloyd and Bailey Schott at Carsey for layout and communications expertise; the state employees and nonprofit partners who offered expert insight into the survey instrument; and the PDG Leadership Team for their thought partnership across the project.

Jess Carson, PhD, is the director of the Center for Social Policy in Practice and a research assistant professor at the University of New Hampshire’s Carsey School of Public Policy. Jess studies how policy affects people, focusing on how legislative and administrative decisions shape access to resources available through work, the social safety net, and community settings.

Sarah Boege, MPP, is a senior policy analyst with the Center for Social Policy in Practice at the Carsey School of Public Policy. Sarah supports Carsey research through data collection and analysis, GIS mapping, and translating and disseminating research findings. At the core of their past and current work is the use of research to inform more equitable and accessible policy, practice, and decision-making.
ABOUT THE 2022 NEW HAMPSHIRE PRESCHOOL DEVELOPMENT GRANT FAMILY NEEDS ASSESSMENT SURVEY
What was the survey?
The 2022 New Hampshire Preschool Development Grant (PDG) Family Needs Assessment Survey. The goal of the survey was to collect information on family well-being, family needs, social service program experience, and remaining needs facing New Hampshire families with children under the age of 9.
Who was invited?
To be eligible to participate in this survey, respondents had to be at least 18 years old, be the parent or guardian of one or more children under age 9, and live in New Hampshire year-round or be a seasonal resident who is registered to vote in New Hampshire. Parents were invited to participate in two different phases. In Phase 1, the UNH Survey Center contacted their existing panel of New Hampshire residents that participate in regular text-to-web surveys (known as the Granite State Panel). In Phase 2, the Parent Information Center (PIC)—a nonprofit family-focused agency—tapped their statewide network of family-serving agencies to invite eligible parents to participate. This second phase resulted in a convenience sample, meaning respondents recruited through partner networks were not randomly selected to participate.
PIC disseminated “open” survey links (that anyone could click and open) among their networks. Unfortunately, the accessible links were infiltrated by fraudulent respondents quickly, with some gathering hundreds of illegitimate responses per hour. Each time a link was compromised it was closed, a new link was created, and recruitment materials (i.e., flyers) were updated accordingly and re-distributed to partners. Fraudulent and nonhuman (“bot”) respondents were anticipated, and an extensive screening process was employed by Carsey researchers to endeavor to distinguish eligible respondents from fraudulent ones. The next round of outreach from PIC took a very grassroots approach to avoid strategies that led to compromised links (such as email blasts, electronic newsletters, or using social media to advertise the study). PIC staff individually called over 500 organizations that serve families with young children, explicitly stating that groups could only share the survey with families via email or text. PIC then shared the survey materials via email with the contacts we reached, again noting the restrictions in bold. PIC staff posted survey fliers in locations that families with young children frequent, such as the children’s section of bookstores, and staffed events such as back-to-school nights to hand out flyers to families in attendance. Thanks to PIC’s dedication and intentional outreach, fraudulent responses were a non-issue in this second round of survey recruitment.
Who participated?
From the Granite State Panel, 127 eligible parents participated. Through more general recruitment via PIC, an additional 541 eligible parents participated in the survey. Thus, this brief includes data from a total of 668 respondents. The distribution of respondents across the state is shown in the map.
Map of Respondents to the 2022 New Hampshire Preschool Development Grant Family Needs Assessment Survey
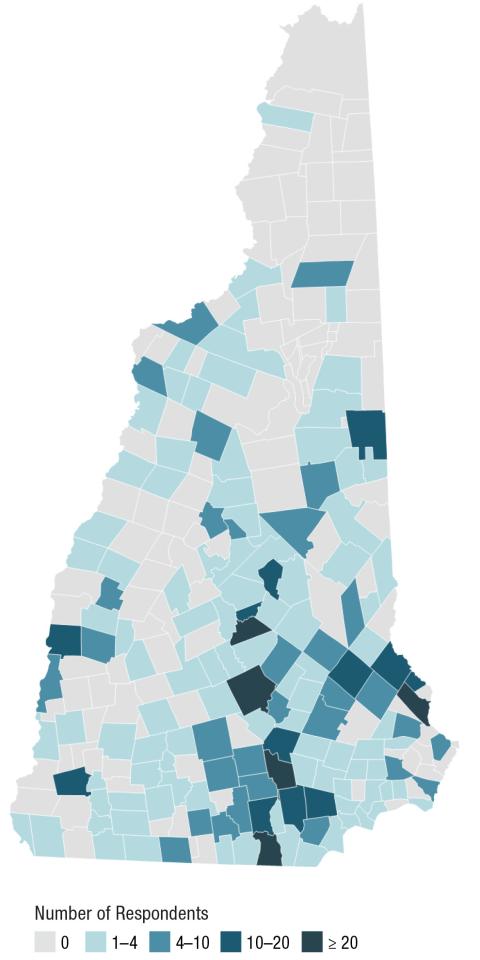
Source: UNH Carsey School analysis of 2022 NH PDG Family Needs Assessment Survey.
What did participants do?
Participants were asked to complete a one-time online survey about their use of child care, social support programs, child development concerns, employment, and any medical, physical, behavioral, and mental health needs of their children. To inform the early childhood systems work of the Preschool Development Grant, this survey was developed in partnership with the New Hampshire Department of Health and Human Services, the New Hampshire Department of Education, the Preschool Development Grant Leadership team, the UNH Survey Center, and the UNH Carsey School of Public Policy. The survey took a median of 11 minutes to complete, and respondents who were not part of the Granite State Panel (n=127) were offered a $10 Amazon gift card for their participation. Participants were surveyed between July 13 and October 4, 2022.
Are these data representative of New Hampshire parents?
It depends. The parents reached in Phase 1 by the UNH Survey Center (n=127) are part of a panel designed to yield a representative sample. However, the sample reached in Phase 2 via local partners was not part of a random sample and thus is not representative. Because it was not possible to know how many New Hampshire residents with a child under age nine received the invitation to participate, we cannot estimate a response rate to Phase 2 of this survey. For Phase 1, 21 percent of the selected sample completed the survey; however, half of those respondents did not have children in the proper age range, resulting in 11 percent of the initially contacted sample being both in-universe and completing the survey. Therefore, this brief describes findings as among “respondents” rather than all parents. However, this sample does match the characteristics of New Hampshire parents of children under age nine derived from U.S. Census Bureau data on several dimensions, including the distribution of child age, employment status, race-ethnicity, and language is spoken. The sample is slightly younger, more educated, and more often rural than New Hampshire parents overall. Although not representative of parents statewide, results here can shed light on some of the skills, resources, and needs that are relevant to at least a portion of this population.
This opportunity is funded by NH’s Preschool Development Grant, sponsored by the U.S. Department of Health and Human Services, Administration for Children and Families (Award# 90TP0060). Any opinions, findings, conclusions, or recommendations expressed in this publication do not necessarily reflect the views of any organization or agency that provided support for the project.