Key Findings


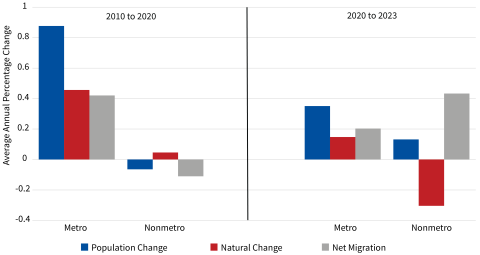
Demographic trends in rural America have been impacted by recent economic, social, and pandemic turbulence. The nonmetropolitan (rural) population grew between April of 2020 and July of 2023 because a large net migration gain offset the growing excess of deaths over births fostered by Covid-19 (Figure 1). In contrast, between 2010 and 2020 rural America lost residents for the first time in history, both because more people left rural areas than moved to them and because the excess of births over deaths dwindled. Recent rural population gains are smaller than those in metropolitan areas but are an improvement compared to the rural population loss of the prior decade.
Migration Gains Offset Covid Deaths
The recent rural population gain of 197,000 is striking given that pandemic-era deaths exceeded births in nonmetropolitan areas by a staggering 454,000 between April of 2020 and July of 2023, compared to a net natural loss (more deaths than births) of just 19,000 in the three years before the pandemic. One bleak statistic underscores Covid’s grim impact on rural America: 81 percent of all rural counties had more deaths than births during the pandemic, far more than in any earlier period. Yet, the pandemic-era migration gain of 651,000 exceeded the substantial natural loss. Nearly 61 percent of the rural counties gained migrants recently compared to just 33 percent in the prior decade.

Source: U.S. Census Bureau Estimates. Analysis: K. M. Johnson, Carsey School, University of New Hampshire.
Population Gains Were Greatest in Amenity Areas
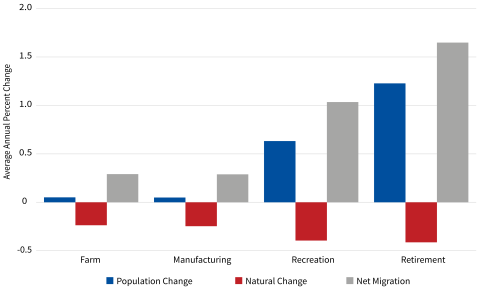
Even though rural America had an overall population gain between 2020 and 2023, just 45 percent of all rural counties gained population. Most of the recent nonmetropolitan population increase accrued to high amenity recreational and retirement areas (Figure 2). Here migration gains accelerated because pandemic-related remote work arrangements and early retirements gave people, including many from urban areas, more residential flexibility. In addition, current rural residents were reluctant to leave during the pandemic which diminished the stream of outmigrants. In other rural counties, including some specializing in farming and manufacturing, there were modest population increases because minimal migration gains offset increased deaths from Covid. Elsewhere in rural America, counties with long histories of population decline continued to lose population. Many have suffered such protracted young adult outmigration that few young adults remain to produce children to offset the growing deaths among their aging populations. For counties that have been losing population for decades, sustained net migration gains provide the only demographic lifeline to stave off depopulation. Whether recent nonmetropolitan migration gains will continue in this turbulent era remains to be seen, as does the future of many rural areas.

Source: U.S. Census Bureau Estimates. Analysis: K. M. Johnson, Carsey School, University of New Hampshire.
This analysis uses data from the Census Bureau Population Estimates Program, April 1, 2020, to June 30, 2023. Although the Bureau uses the best data and algorithms available at the time of release to generate the data, they remain estimates. Counties are the unit of analysis and are classified as nonmetropolitan (rural) and metropolitan (urban) based on the OMB 2018 Metropolitan Definition. The county types are from the USDA Economic Research Service County Typology. The terms rural and nonmetropolitan are used interchangeably here as are the terms urban and metropolitan.
About the Author
Kenneth M. Johnson is senior demographer at the Carsey School of Public Policy, professor of sociology at the University of New Hampshire, an Andrew Carnegie Fellow, and a researcher at the NH Agricultural Experiment Station. This research has been supported by the station through joint funding from the USDA National Institute of Food and Agriculture (under Hatch-Multistate project W-5001, award number 7003437) and the state of New Hampshire. The opinions are his and not those of the sponsoring organizations.
© 2024. University of New Hampshire. All rights reserved.