There has been substantial debate over whether higher levels of unemployment benefits have been keeping workers at home. Twenty-six states have announced that they are curtailing enhanced benefits because of this concern—with the first curtailments going into effect on June 12. The April and May state-level unemployment data from the Bureau of Labor Statistics offer one piece of evidence that workers are not (illegally) refusing to seek or accept employment because of unemployment benefits.
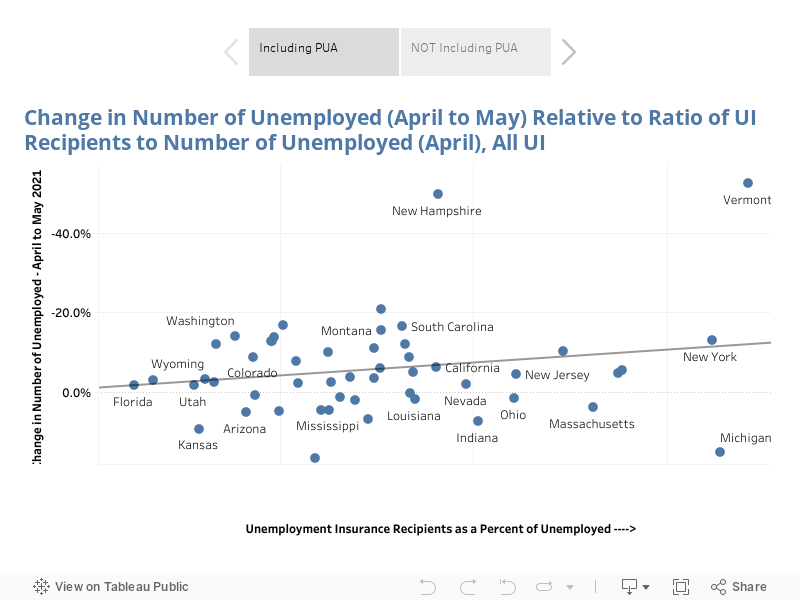
States vary substantially in the percentage of their unemployed who receive unemployment insurance benefits (UI). State eligibility rules vary significantly and the likelihood of meeting the criteria can differ depending on industry concentration and other factors. Although there are many factors at play, if unemployed workers are staying home because of unemployment benefits, one might expect states with a higher share of their unemployed receiving benefits to see a lower share of their unemployed re-entering the workforce. Yet, from March to April, and again from April to May, we do not see that pattern.
The figure below is a scatter plot showing, from left to right, states going from lower to higher shares of their residents receiving unemployment benefits as of April. The Y-axis represents the drop in the number of unemployed from April to May going from smaller to larger drops from bottom to top. A pronounced downward slope would show that states with a higher share receiving benefits had fewer becoming re-employed—suggesting that the availability of UI was driving people to stay unemployed. There is, however, no clear pattern. In fact, the slope is upwards. The same pattern was seen last month.
The figure can also be toggled to show the same graph but with the special COVID recession benefits for the self-employed taken out. The data on this Pandemic Unemployment Assistance (PUA) program have been volatile for some states and for some self-employed the meaning of “unemployed” can be somewhat ambiguous. This graph, however, shows the same lack of any indication that the benefits are keeping workers out of the job market.
There are many factors that could explain the pattern here. Some of the data are volatile and recipiency rates are complicated right now, as what it means to be unemployed is in the middle of a transition given the unique circumstances of the COVID recession. Nevertheless, this one indicator, for two consecutive months, offers no support for the proposition that UI benefits are keeping people out of the workforce in any significant numbers.