Key Findings
All six New England states gained population between July of 2022 and July of 2023, according to new Census Bureau estimates. This contrasts with the four preceding years, when at least one state lost population in each year (Figure 1). New England’s recent demographic trends are consistent with those in other states, where larger population gains occurred last year due to fewer deaths from Covid and increased migration.
Maine and New Hampshire continued to gain population last year, just as they did in each of the preceding four years. This is despite the fact that New Hampshire and Maine have consistently had more deaths than births, including last year. Maine had the largest percentage population gain last year, though it was smaller than the year before. New Hampshire’s population gain also diminished. The population gains in both states were due to a net migration gain, mostly from an influx of migrants from other states. Deaths also exceeded births in Rhode Island and Vermont, but they also gained population because they had a migration gain sufficient to offset this natural loss. Though Covid mortality is finally waning, only Connecticut and Massachusetts had more births than deaths last year. Massachusetts gained population for the first time in four years. It grew because births exceeded deaths and immigration offset a continuing outflow of domestic migrants. Connecticut’s population gain followed the same pattern as Massachusetts, with more births than deaths and an influx of migrants. Overall, New England’s population gain in the past year was only 0.26 percent compared to a U.S. gain of 0.49 percent. Both these population gains exceeded those of last year, but are low compared to historical trends.
Figure 1. Annual Population Change for New England States, 2018 to 2023
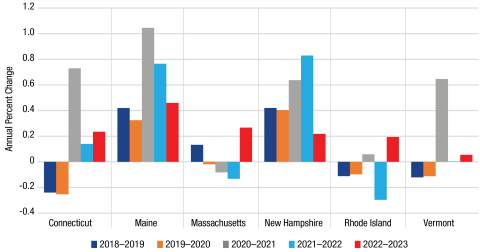
Source: U.S. Census Bureau Population Estimates. Analysis: K.M. Johnson, Carsey School, University of New Hampshire.
Methods and Data
This analysis is based on Census Bureau Population Estimates for April 1, 2020, to June 30, 2023 released on December 19, 2023. Readers should recognize that although the Bureau uses the best data and algorithms available at the time of release to generate the data, they remain estimates.
About the Author

Kenneth M. Johnson is senior demographer at the Carsey School of Public Policy, professor of sociology at the University of New Hampshire, and an Andrew Carnegie Fellow. His research was supported by the NH Agricultural Experiment Station through joint funding from the USDA National Institute of Food and Agriculture (under Hatch-Multistate project W5001, award number 7003437) and the state of New Hampshire. The opinions are his and not those of the sponsoring organizations.