Key Findings
In August 2020, we wrote on the massive job loss in the United States over the early stages of the COVID-19 pandemic and the racial/ethnic and gender disparities in job recovery.1 From February to June 2020 the United States had experienced a net loss of more than 15 million workers, but the declines were greater among women than men (11.2 percent compared to 7.9 percent), and greater for Blacks (11.5 percent) and Latinos (12.3 percent) than for Whites (7.5 percent).
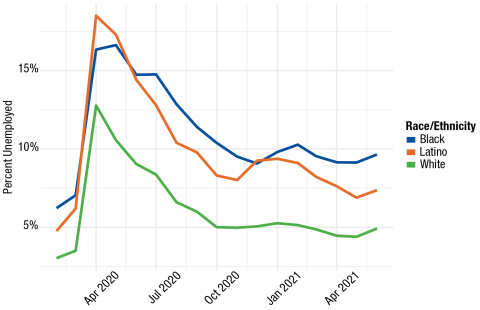
A lot has happened since then. The latest unemployment picture (see Figure 4 below) still shows that Blacks have an unemployment rate nearly two times higher and Latinos 1.5 times higher than Whites. The relative unemployment rankings of these groups mimic those of the pre-COVID period, but jobless rates for all groups remain higher than they were prior to the pandemic.
This policy brief provides an update on the employment trends that took place between February 2020 and June 2021. Our analysis focuses on the change in the number of persons with a job as well as on the great changes that have occurred in the size of the civilian labor force and the levels of unemployment. We further contrast the employment patterns of U.S. workers through comparisons across gender, racial/ethnic, and educational lines, and, for Latinos, nativity status. The analysis subsequently highlights disparities in the ability to work from home during the pandemic and variations in the fortunes and woes of the U.S. workforce.
Our analysis shows much change in certain respects and some continuities concerning employment patterns. Some groups of individuals have surpassed the employment levels they had before the plunge of the economy in the spring of 2020, other groups are getting close to that level, and other groups are further below their job levels of that time. However, one thing is certain: the attainment of or close proximity to regaining the employment level of February 2020 does not necessarily translate to low unemployment rates in June 2021. Such seeming contradictions reflect the changes that have occurred in the civilian population 16 and older over the 16 months to June 2021. There has been much movement in and out of the civilian labor force since the pandemic. Many persons have had to leave the labor force to take care of children or address other familial responsibilities, some have lost their jobs, some have found jobs, and still others have opted for retirement. Sadly, many others who were part of the civilian labor force in February 2020 are no longer with us—more than 653,000 persons in the United States have died due to COVID-19 as of this writing.
The Big Picture
There have been significant improvements in the number of individuals holding a job since the job plunge in April 2020, when there were 25 million fewer workers than two months earlier. Nonetheless, employment has not recovered, as there were still 5.9 million fewer people with a job in June 2021 than in February 2020 (Figure 1), a drop of 3.7 percent.
Figure 1. Total number of employed persons, February 2020 to June 2021

Source: IPUMS CPS Monthly Data. Calculations by Corey S. Sparks, PhD.
The full employment panorama, however, shows that the number of people who are unemployed soared 59 percent between February 2020 and June 2021, and participation in the civilian labor force plunged by 2.1 million persons, a drop of 1.3 percent, during this period. In fact, as these individuals dropped out of the labor force, they contributed to the expansion of 3.8 million persons 16 and older who were not part of the labor force over those 16 months. The growth of persons not in the civilian labor force was disproportionately among those who retired: 92 percent of the 3.8 million who left the labor force retired.
All told, the nation’s unemployment rate stood at 6.2 percent in June 2021 compared to 3.9 percent in February 2020. Underlying this top-line number is much variation in job loss and changes in the civilian labor force along race/ethnic, gender, and, for Latinos, nativity lines.
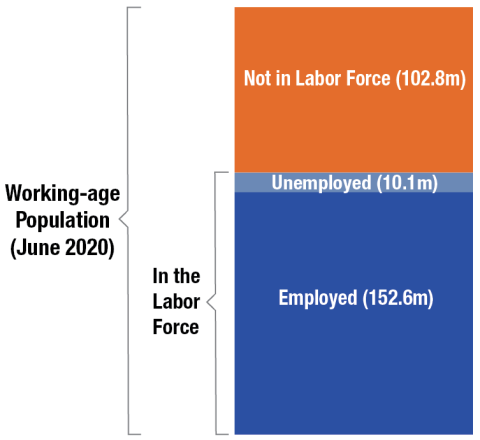
To understand how the pandemic has affected joblessness in the United States, it is important to understand the technical definition of unemployment. Calculations begin with the civilian working-age population, i.e., those 16 years of age and older, which as of June 2020 was 265.5 million. (Note that in our analysis, we focus on the civilian labor force, thus excluding workers who are part of the military.) The civilian working-age population falls into two distinct groups: those participating in the labor force (162.7 million as of June 2020) and those not participating (102.8 million). The labor force participation rate is computed by dividing the number of working-age people participating in the civilian labor force by the total working-age population. In June 2020 that share was 61.3 percent (162.7 million divided by 265.5 million).
The unemployed are part of the labor force; though they are not currently working, they are actively pursuing work. The unemployment rate is calculated by dividing the number of people who are currently not working but actively looking for work (10.1 million in June 2020) by the total population in the civilian labor force (162.7 million). This share—the unemployment rate—was 6.2 percent in June 2020. The complement to the unemployment rate is the employment rate, which is obtained by dividing the number of people who are currently working (152.6 million) by the total population in the civilian labor force. This share was 93.8 percent in June 2020.
Many Fewer Women With a Job and in the Labor Force
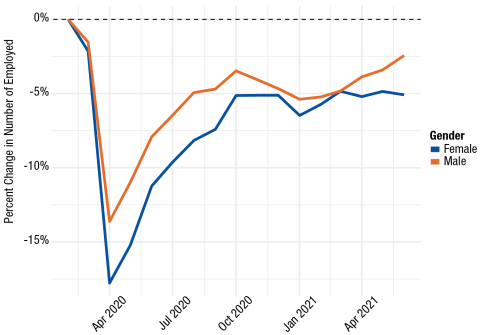
Job recovery varies tremendously along gender lines. There were 5.1 percent fewer employed women in June 2021 than in February 2020 and 2.4 percent fewer employed men, meaning that women were more than twice as likely as men to have had a job in February 2020 but to lack one (whether through unemployment or by leaving the labor force) in June 2021 (Figure 2).
Not only were there inordinately fewer women with a job, but they were much more likely than men to leave the civilian labor force—that is, they currently do not have a job and they are not actively seeking one. Indeed, 61 percent of women who no longer have a job were no longer part of the labor force in June 2021 compared to 19 percent of men. Thus, there were 4.5 women who were no longer in the labor force in June 2021 for each one man who had made the exit. This disparity clearly illustrates the gendered impact of the pandemic on work activity.
Other barometers point to the disadvantaged position of women in the workforce compared to men. For example, between February 2020 and June 2021, the number of unemployed soared by 78 percent for women compared to 45 percent for men, the number of persons not in the labor force rose by 1.4 percent for women and declined by 0.6 percent for men, and the number of retired persons increased by 7.8 percent for women compared to 6.7 percent for men.
The greater decline of women in the civilian labor force needs to be taken into account in making sense of unemployment rates of women and men. In June 2021, women (6.3 percent unemployment) and men (6.2 percent) essentially had the same level of unemployment. In this regard, the unemployment rate of women looks comparable to that of men, but it hides the large number of women who have exited the labor force and are no longer counted in the computation of the unemployment rate.
Source: IPUMS CPS Monthly Data. Calculations by Corey S. Sparks, PhD.
A Paradox: Fewer Whites With Jobs, But Higher Unemployment Among Blacks and Latinos
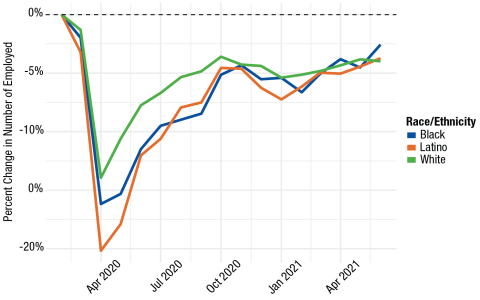
In our brief on this subject last year, we described how workers of color were particularly hard hit during the early phases of the pandemic. Now, the number of persons holding a job have significantly shifted across racial/ethnic lines. There were 4 percent fewer White workers in June 2021 than in February 2020 compared to lower declines among Blacks (-2.6 percent) and Latinos (-3.6 percent) (Figure 3). Whites accounted for two-thirds of the decline of 5.9 million workers over the 16 months to June 2021, Latinos for 17 percent, Blacks for 8 percent, and all other racial groups for 8 percent.
Despite the more favorable employment trends of Blacks and Latinos compared to Whites, the lower unemployment rates of Whites found earlier persist in June 2021. The unemployment rate for Blacks was 9.7 percent, 1.9 times higher than the rate for Whites (5 percent); for Latinos the 7.5 percent unemployment rate was 1.5 times higher than that for Whites (Figure 4).
What accounts for this paradox, a more favorable job situation among Blacks and Latinos but more unfavorable levels of unemployment compared to Whites? The primary explanation is that there has been a greater tendency for Whites to leave the labor force than for Latinos and Blacks. The number of Whites in the civilian labor force dropped by 2.1 percent between February 2020 and June 2021 compared to a dip of 0.9 percent among Latinos; Blacks actually experienced a growth of 1 percent in the labor force. The labor force exit of Whites is dominated by the growth of 2.2 million in the White retiree population, which rose by 6 percent between February 2020 and June 2021—a growth rate 2.6 times higher than that experienced in similar length periods before the pandemic (e.g., the retiree population grew 2.3 percent between February 2018 and June 2019). Still, despite the absolute numbers being much smaller, the retiree populations of Latinos (13.9 percent) and Blacks (9.7 percent) grew at a swifter pace than that of Whites over the 16 months to June 2021.
Figure 3. Percent change in employed persons by race/ethnicity, February 2020 to June 2021
Source: IPUMS CPS Monthly Data. Calculations by Corey S. Sparks, PhD.
Figure 4. Percent of civilian labor force unemployed by race/ethnicity, February 2020 to June 2021
Source: IPUMS CPS Monthly Data. Calculations by Corey S. Sparks, PhD.
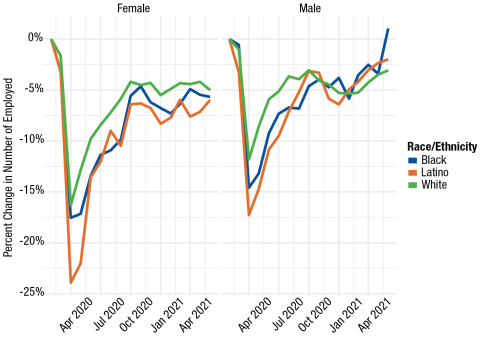
Rising Employment for Men of Color, Worse for Women Across the Board
The more favorable employment situation of Latinos and Blacks, however, occurred only for men. Between February 2020 and June 2021, the number of Black men with a job inched upward by 1 percent, while that of Latino men dropped by 1.8 percent, less than the decline of 3.1 percent of Whites (Figure 5). In contrast, women have fared much worse across racial/ethnic groups: 5.9 percent fewer Latina women had a job in June 2021 than 16 months earlier, 5.7 percent fewer Black women, and 5 percent fewer White women.
The brighter job position of Black and Latino men is due, in part, to their rising labor market activity. Between February 2020 and June 2021, 4.1 percent more Black men and 0.3 percent more Latino men were in the civilian labor force. The other four subgroups experienced declines in their labor force tallies: -2.6 percent for White women, -2.3 percent for Latina women, -1.7 percent for Black women, and -1.6 percent for White men.
The significant growth of persons who have retired occurred across all groups during the pandemic. Among White women 1.2 million retired over the 16-month period, accounting for about one-third of persons who have made this decision; White men (1 million retirees) accounted for another one-fourth. However, the pace of growth in the retirement population has been especially high among Latina and Black women. There are now 427,000 more Latina women and 315,000 more Black women who are retired compared to before the pandemic, a rate of growth of 18.8 percent and 12.3 percent, respectively.
Source: IPUMS CPS Monthly Data. Calculations by Corey S. Sparks, PhD.
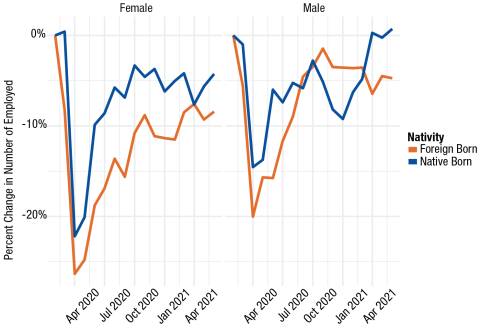
More Native-Born Latino Workers, Fewer Foreign Born
Latinos born in the United States tend to fare better socioeconomically than those born outside of this country. We observe this when it comes to trends in employment over the 16-month period reviewed here, when native-born Latino men and Latina women did much better than their immigrant counterparts. While native-born Latino men experienced a bump of 1 percent in persons having a job, there were 4.6 percent fewer employed foreign-born men. Among women, the nativity gap was even wider with 4.3 percent fewer U.S.-born women working compared to 8.3 percent fewer foreign-born women (Figure 6). No other group examined here has sustained such a great plunge in employment as have Latina immigrant women, the closest being Black women, who experienced a decline in employment of 5.7 percent.
This nativity divide concerning the job fortunes of Latinos reflects, in part, the distinct population growth rates of U.S.- and foreign-born Latinos due to age structure and immigration trends. The native-born civilian labor force, which includes the U.S.-born children of immigrants, is quite young, with a median age of 32 in June 2021; the median age of the foreign-born labor force is 44. In addition, over the last decade immigration has slowed significantly, particularly among those originating from Mexico,2 and it came to a halt during the pandemic. Thus, between February 2020 and June 2021, the native-born Latino civilian population 16 and older rose by 4.2 percent, as these young Latinos reached working age, while the foreign-born Latino civilian population remained virtually unchanged, with a 0.1 percent increase, as few newcomers arrived. These disparate growth trends were already afoot prior to the pandemic: between February 2018 and June 2019, the native-born Latino civilian population 16 and older increased by 5.0 percent, while that of the foreign born dipped by 0.1 percent.
Source: IPUMS CPS Monthly Data. Calculations by Corey S. Sparks, PhD.
Unemployment Still a Reality for Workers of Color
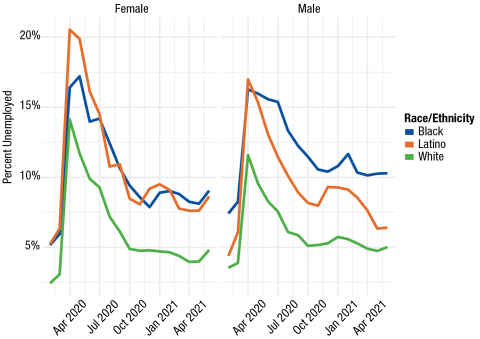
Despite the favorable trend concerning more Black men and native-born Latino men working now than prior to the pandemic, Black and Latino men and women have higher unemployment rates compared to Whites (Figure 7). White women (4.9 percent) and men (5.1 percent) had the lowest unemployment rates in June 2021, while Black men (10.3 percent), Black women (9.2 percent), and Latina women (8.8 percent) had the highest.
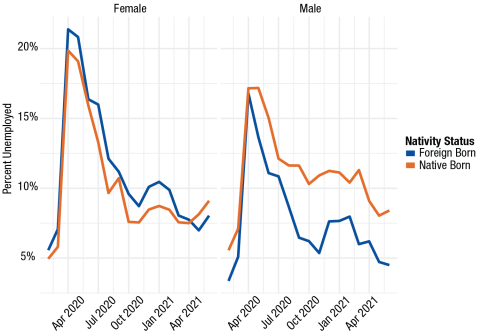
Higher Joblessness Among U.S.-Born Latinos Than Immigrants
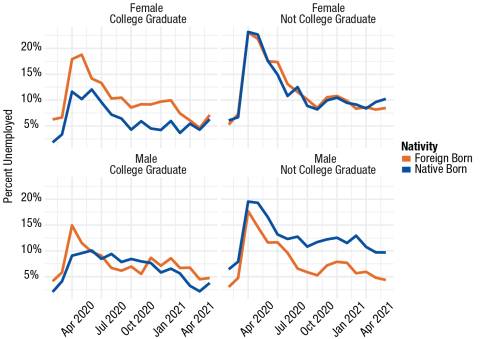
Another seeming anomaly is that, despite more favorable trends regarding employment among native-born Latinos compared to their immigrant counterparts, Latina women (9.7 percent) and Latino men (8.3 percent) born in the United States have higher unemployment rates than their immigrant counterparts (Figure 8). Foreign-born Latino men have the lowest jobless rate at 4.4 percent. These trends are consistent with those we observed a year ago, although at that time immigrant women had higher unemployment levels than U.S.-born women.
Figure 7. Percent of civilian labor force unemployed by race/ethnicity and gender, February 2020 to June 2021
Source: IPUMS CPS Monthly Data. Calculations by Corey S. Sparks, PhD.
Figure 8. Percent of Latina/o civilian labor force unemployed by nativity and gender, February 2020 to June 2021
Source: IPUMS CPS Monthly Data. Calculations by Corey S. Sparks, PhD.
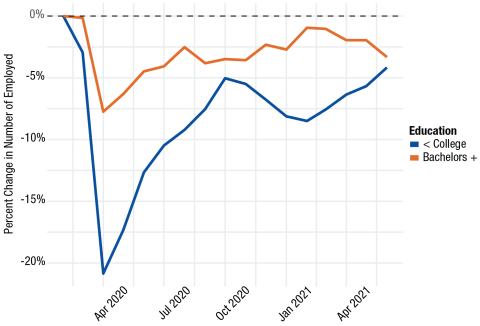
The College Diploma Divide
There are clearly two worlds associated with how well U.S. workers have fared in the pandemic. While those with at least a bachelor’s degree have generally been able to keep their jobs, the situation is much more precarious among those who do not have a college diploma. This segment of the analysis focuses on persons 25 and older, the group that the U.S. Census Bureau uses in the computation of overall educational attainment levels.
The number of persons without a college diploma who had a job dropped by 6.1 percent between February 2020 and June 2021, a decline that is more than twice as high as that for individuals with a bachelor’s degree or higher (2.6 percent) (Figure 9). Notably, 6.4 million fewer persons 25 and older had a job in June 2021 than in February 2020. Of these persons who no longer had a job, three-fourths were persons who are not college graduates, although they made up only 58 percent of the civilian labor force in February 2020.
Less-educated persons were also more likely to exit the civilian labor force than were their more-educated counterparts (declining 3.5 percent and increasing 1.0 percent, respectively) over the 16-month period. The retirement option appears to be more common among the more educated: the number of retirees increased by 11 percent between February 2020 and June 2021 among this group, nearly twice as high as the percent increase among persons without a college diploma (5.8 percent).
The unemployment rate of people without a bachelor’s degree stood at 6.8 percent in June 2021, almost twice as high as that of persons with a bachelor’s degree or higher (3.6 percent).
Source: IPUMS CPS Monthly Data. Calculations by Corey S. Sparks, PhD.
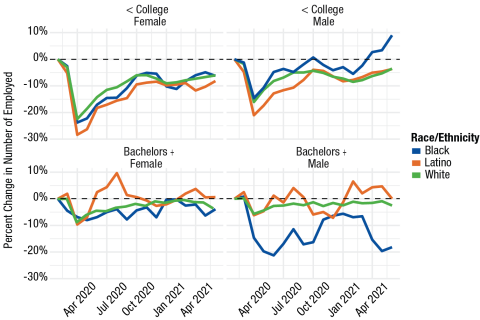
The Worsening Job Situation of Less-Educated Women and Black Men With a College Degree
However, among persons with lower levels of education, it is women across the board who have been particularly hard hit (Figure 10), with upward of 9 percent fewer having a job in June 2021 than in February 2020 (specifically, a decline of 9.9 percent for Black women, 9.4 percent for White women, and 9 percent for Latinas). Less-educated White men (-6.1 percent) lag behind Black (+8.1 percent) and Latino (-2.4 percent) men, with fewer having a job in June 2021 than 16 months earlier. Women (White, -6.8 percent; Latina, -5.7 percent; Black, -4.9 percent) and White men (-4.6 percent) with less education have also experienced greater exit rates from the civilian labor force. On the other hand, there were 11.8 percent more Black men without a college diploma who were part of the labor force in June 2021 than in February 2020. Less-educated Latino men are also close to breaking even, with 0.9 percent fewer being in the labor force now than prior to the pandemic.
Overall, persons with college diplomas have fared much better, with Latino men (0.8 percent) and Latina women (0.3 percent) experiencing increasing employment in June 2021 than 16 months earlier. Latina women (4.5 percent) and Latino men (3.0 percent) also posted a rise in their participation in the civilian labor force. More-educated Black men, however, represent the anomaly. One-fifth fewer of them had a job in June 2021 compared to February 2020.
Source: IPUMS CPS Monthly Data. Calculations by Corey S. Sparks, PhD.
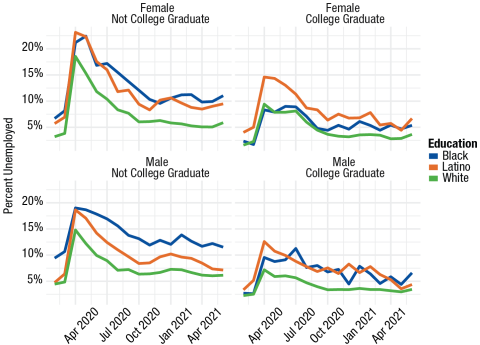
People of Color Continue to Suffer From Higher Unemployment, Regardless of Educational Level
Across educational levels and gender, Whites had the lowest unemployment rates in June 2021. White men and White women registered the lowest jobless rates, whether they had less education (5.5 percent unemployment) or more (just over 3 percent) (Figure 11). In fact, Black men and Latina women with a college diploma are more likely to be unemployed than White men and women who do not have a college degree. Among all categories, Black men (11.3 percent), Black women (10 percent), and Latina women (8.3 percent) had the highest rates of unemployment. For Black men with less education, their significant gains in the labor force and jobs did not translate to lower unemployment levels.
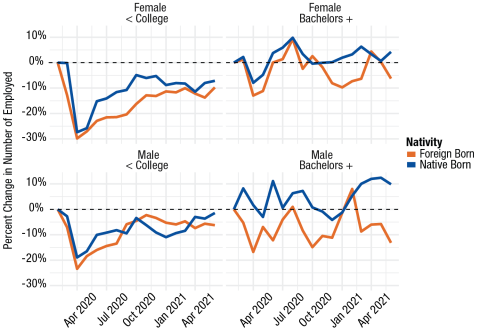
Varying Employment Trends of Native- and Foreign-Born Latinos
Employment change has varied tremendously among Latinos once we account for nativity status, educational level, and gender (Figure 12). The subgroups examined here can be grouped into three categories based on their employment trends over the course of the 16 months to June 2021. The first category consists of those who were working more in June 2021 than in February 2020: native-born Latino men (an increase of 11.3 percent) and Latina women (4.1 percent) with a college diploma. The second category includes groups with a slight decline in persons holding jobs between February 2020 and June 2021: foreign-born (-1.9 percent) and native-born (-3.0 percent) Latino men with a college degree are close to equalizing their percentages with a job 16 months earlier. The third category consists of groups that have fared the worst, with much lower percentages of persons having a job now than before the pandemic: fewer foreign-born men with a college diploma (-12.8 percent), foreign-born (-9.7 percent) and native-born women (-8.2 percent) without a college diploma, and foreign-born women with a college diploma (-6.4 percent) had a job in June 2021 than in February 2020.
Figure 11. Percent of civilian labor force 25 and older unemployed by education level, race/ethnicity, and gender, February 2020 to June 2021
Source: IPUMS CPS Monthly Data. Calculations by Corey S. Sparks, PhD.
Figure 12. Percent change in employed Latina/os 25 and older by education level, nativity, and gender, February 2020 to June 2021
Source: IPUMS CPS Monthly Data. Calculations by Corey S. Sparks, PhD.
Source: IPUMS CPS Monthly Data. Calculations by Corey S. Sparks, PhD.
Four groups stand out with respect to significant changes in the size of the civilian labor force. Native-born Latino men (14.4 percent) and Latina women (8.4 percent) with college degrees have experienced significant increases in their participation in the civilian labor force; foreign-born Latino men with a college diploma (-11.5 percent) and foreign-born Latina women with lower levels of education (-9.7 percent) have sustained major declines in the civilian labor force.
The unemployment rates in June 2021 vary significantly as well. College-educated Latino men (foreign born, 3 percent; native born, 3.5 percent) have the lowest levels of unemployment (Figure 13). In contrast, native-born Latina women with lower levels of education (9.7 percent) and foreign-born Latina women with a college degree (8.5 percent) have the highest jobless rates.
Who Gets to Work From Home?
In March 2020, in response to the COVID-19 pandemic and following shutdowns across the United States, many employees moved to teleworking. At first seen as a temporary measure, working from home soon became a new normal for those employed in occupations that did not require personal contact and physical presence at the workplace. More than one year since the onset of the pandemic, a large segment of the workforce is still engaged in remote work. Despite all the challenges associated with shifting to working from home (technological issues, blurred boundaries between work and personal life, child care responsibilities, and so forth), teleworking allowed workers to keep their employment and minimized health risks throughout the pandemic.
The wide inequalities in job loss and recovery that have disproportionately hit the most disadvantaged demographic groups are in part associated with the ability to work remotely.3 More-educated, high-income professionals engaged in occupations that require greater reliance on technology embraced the opportunity of working from home, while the rest of the labor force suffered from job losses or continued to perform essential and frontline jobs bearing high health risks. Racial/ethnic and educational divisions in teleworking echo the disparities in unemployment rates and labor force exits described above.
In this part of the analysis, we compare the percent of employees working from home during the May 2020–June 2021 period across racial/ethnic, gender, and educational-attainment categories. Figure 14 demonstrates the overall racial disparities in the opportunity to work remotely. Throughout the 13 months, Whites were more likely to work from home than Blacks and Latinos. The gap between Whites and Latinos is particularly pronounced: around 15 percent of White workers were still working from home in June 2021 compared to less than 10 percent of Latinos.
Gender comparisons across all three racial/ethnic groups reveal that women have been more likely to telework during the pandemic than men (Figure 15). We believe that in this case the gender gap does not point to a more privileged position of women in the labor market (in terms of occupations and skills), but rather reflects the fact that women were forced to turn to teleworking to fulfill child care responsibilities. Yet again, across genders, Whites have the advantage over other racial/ethnic groups in terms of being able to perform their jobs from home, meaning that despite these child care responsibilities many women of color and those with lower levels of education were unable to work from home.
Figure 14. Percent of U.S. employees who worked from home, by race/ethnicity, May 2020 to June 2021
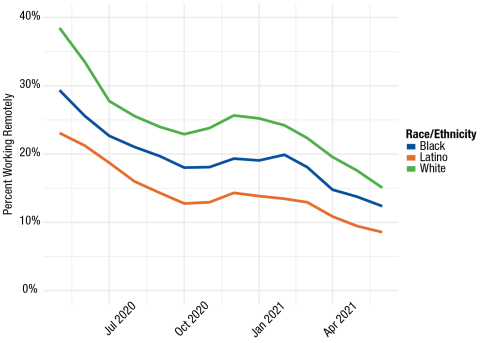
Source: IPUMS CPS Monthly Data. Calculations by Corey S. Sparks, PhD.
Figure 15. Percent of U.S. workers who worked from home by race/ethnicity and gender, May 2020 to June 2021
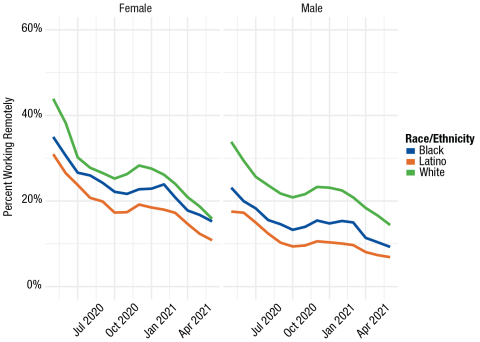
Source: IPUMS CPS Monthly Data. Calculations by Corey S. Sparks, PhD.
Source: IPUMS CPS Monthly Data. Calculations by Corey S. Sparks, PhD.
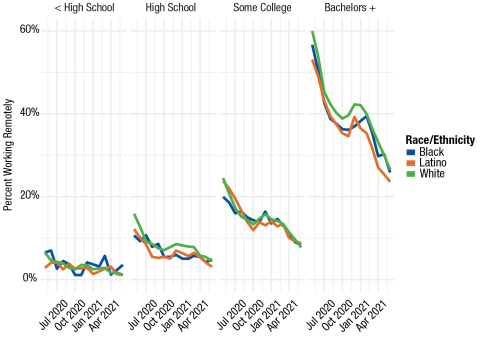
Our findings, however, show that the highest disparities in teleworking are associated with educational differences (Figure 16). Workers holding at least a bachelor’s degree are the most privileged with respect to teleworking: the percent of Whites with a bachelor’s degree working from home was as high as 60 percent in May 2020 and decreased to 30 percent in May 2021; for Black and Latino workers with a bachelor’s degree the percent working remotely was lower. The remote work patterns for the least-educated group depict a very different picture: the percent of remote workers across all races and ethnicities in this group never exceeded 10 percent. That racial/ethnic gaps in working remotely decrease once populations are stratified by education suggests that overall racial/ethnic differences are highly correlated with differences in educational attainment. Race and ethnicity differences are only visible for the highly educated group, reflecting the proposition that education does not translate into occupational prestige and status at the same rate for all racial/ethnic groups. That is, that even highly-educated persons of color are unable to work from home points to smaller protective effects of educational attainment for persons of color. Racial/ethnic differences in work-from-home patterns can be better understood in line with other empirical studies in the field of racial disparities that demonstrate the existence of racial/ethnic gaps in wages, occupational prestige, wealth, and health among highly educated workers.4 Deeper structural causes could be the contributing factors for the racial/ethnic disparities: job segregation due to labor market discrimination, residential segregation (by reducing the quality of education and occupation), and vertical mismatch between the individual’s educational level and education requirements for the occupation (highly educated people of color are channeled into mismatched jobs). 5
Conclusions and Policy Implications
In our earlier analysis of the U.S. job situation in the beginning stages of the pandemic, we discovered that women and persons of color were disproportionately impacted by tremendous levels of job loss, and they lagged significantly behind men and Whites, respectively, in their level of job recovery. Our updated analysis reveals that, while the employment situation has improved noticeably since the economic abyss of the shutdown of the economy in April 2020, we are still a long way from job recovery.6 Further, as we observed about a year ago, women and people of color continue to be the furthest removed from job recovery. We also showed that unemployment rates need to be considered alongside the major declines in the number of persons in the civilian labor force and those holding a job. Finally, demographic groups who were able to work from home—disproportionately White and more-educated workers—have fared much better than those who did not have this safety net.
Our findings have important policy implications for the short- and long-term as, and after, the pandemic recedes. Many people are still without employment due to the loss of jobs that have not yet returned, the obligations they have for child care and elder care, and other situations. Many are on the verge of losing their homes as eviction bans expire. Many families continue to face hunger.7 There is a major need for the creation of policy to ensure that people have their basic necessities met and that they are able to make necessary adjustments, including job retraining, to begin the process of rebuilding their lives in the coming months and years. President Biden’s infrastructure bills would be particularly helpful in putting to work many people who desperately need jobs today. Franklin Roosevelt’s New Deal represents a model for rebuilding and sustaining our country, our workers, and our people.
Furthermore, as numerous industries face job shortages, it is important that policymakers craft policies that support workers on the margins who for too long have endured the lack of basic benefits including sick leave, health insurance, decent wages, parental leave, and affordable child care. Given a major slowdown in U.S. population growth brought about by aging, alongside the reduction of fertility and immigration aggravated by the pandemic, there will be an increasing demand for workers following the pandemic. The competitiveness of businesses will increasingly be tied to investing in their workforces.
Put simply, more than ever we will need creative policies that prioritize the needs of all Americans and especially those who have for too long been relegated to the margins. There is a profound need for bold solutions that change the status quo that has recreated inequality and heightened risks for our most vulnerable citizens.
Methodology
Monthly Current Population Survey microdata are from the Integrated Public Microdata Series, IPUMS–CPS.8 Data are subset to contain only those respondents in the civilian labor force 16 years of age and older. All estimates are weighted by the WTFINL variable to be representative of the U.S. labor force. No statistical testing was done; all estimates presented are population-weighted means, so intergroup comparisons may not have statistical significance. A minimum sample size of 30 respondents for each population subgroup, per month, was used to avoid statistically unstable estimates. The race/ethnicity variable created here is a combination of both the self-reported race and Hispanic/Latino ethnicity of the respondent. Latino/a ethnicity includes all respondents who reported Hispanic/Latino ethnicity, regardless of race; Whites include non-Hispanic White respondents; and Blacks include non-Hispanic Black respondents. Unfortunately, sample sizes were relatively small for other racial groups. All data and code related to this brief are available at Dr. Corey Sparks’s Github repository github.com/corey_sparks/unemployment.
Endnotes
- R. Saenz and C. Sparks, “The Inequities of Job Loss and Recovery Amid the COVID-19 Pandemic” (Durham, NH: Carsey School of Public Policy, 2020), https://dx.doi.org/10.34051/p/2021.3.
- “Far Fewer Mexican Immigrants Are Coming to the U.S.—And Those Who Do Are More Educated,” TheConversation.org, September 9, 2019, https://theconversation.com/far-fewer-mexican-immigrants-are-coming-to-the-us-and-those-who-do-are-more-educated-122524.
- E. Brynjolfsson et al., “COVID-19 and Remote Work: An Early Look at U.S. Data” (Washington, DC: National Bureau of Economic Research, 2020), https:/doi.org/10.3386/w27344.
- W. Emmons and L. Ricketts, “College Is Not Enough: Higher Education Does Not Eliminate Racial and Ethnic Wealth Gaps,” Working Paper (St. Louis, MO: Federal Reserve Bank of St. Louis, 2016), www.stlouisfed.org/~/media/Files/PDFs/HFS/20160525/papers/Emmons-Ricketts-paper.pdf; D. Tomaskovic?Devey, M. Thomas, and K. Johnson, “Race and the Accumulation of Human Capital Across the Career: A Theoretical Model and Fixed?Effects Application, American Journal of Sociology 111, no. 1 (2005): 58–89, https://doi.org/10.1086/431779.
- Yao Lu and Xiaoguang Li, “Vertical Education-Occupation Mismatch and Wage Inequality by Race/Ethnicity and Nativity Among Highly Educated U.S. Workers,” Social Forces (2021), https://doi.org/10.1093/sf/soaa145.
- A. ?ahin, M. Tasci, and J. Yan, “The Unemployment Cost of COVID-19: How High and How Long?” Economic Commentary (Cleveland, OH: Federal Reserve Bank of Cleveland, 2020), https:/g/10.26509/frbc-ec-20200doi.or9.
- J.A. Wolfson and C.W. Leung, “Food Insecurity and COVID-19: Disparities in Early Effects for U.S. Adults,” Nutrients 12, no. 6 (2020): 1648; C. Gundersen, M. Hake, A. Dewey, and E. Engelhard, “Food Insecurity During COVID-19,” Applied Economic Perspectives and Policy 43 (2021): 153–61.
- S. Flood, M. King, R. Rodgers, S. Ruggles, and J. Warren, Integrated Public Use Microdata Series, Current Population Survey: Version 8.0 [dataset] (2021), https://doi.org/10.18128/D030.V8.0.
About the Authors
- Rogelio Sáenz is a professor in the Department of Demography at the University of Texas at San Antonio and a policy fellow at the Carsey School of Public Policy. He has written extensively on issues related to demography, Latinos, race, inequality, and public policy.
- Corey Sparks is an associate professor in the Department of Demography at the University of Texas at San Antonio. He has written extensively on statistical methodology, spatial analysis, and health inequality in the United States and internationally.
- Asiya Validova is a doctoral student in applied demography?in the College for Health, Community and Policy at the University of Texas in San Antonio. Her current research interests include income inequality and health/mortality, immigration and the labor market, children’s health disparities, public policy, and fertility behaviors.