download the brief
Key Findings

Although the distribution of students eligible for free and reduced-price lunch (FRPL) across the state follows established patterns of child and family poverty, there is significant variation by House legislative district.

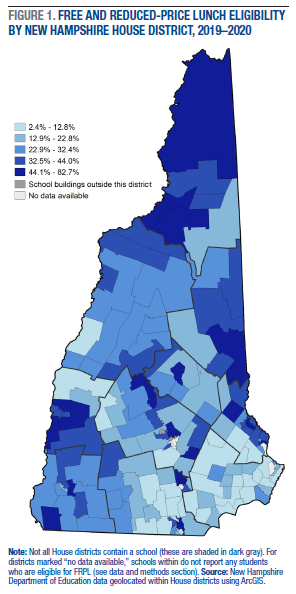
The House district with the lowest FRPL eligibility rate is Rockingham 7 (Windham) at 2.5 percent, and the highest rate is in Hillsborough 12 (Manchester, Ward 5) at 82.6 percent.

Within-county variation in eligibility is especially evident in Hillsborough County, which accounts for two of the five districts with the lowest FRPL rates and four of the five districts with the highest FRPL rates.
Although New Hampshire child poverty is low compared to other states, child well-being within the state varies considerably. And the lack of data sources that allow analysis at the sub-state or sub-county level can complicate local legislators’ efforts to quantify and support low-income children in their districts. This brief translates New Hampshire free and reduced-price lunch (FRPL) eligibility data from the school level to the state House of Representatives legislative district level so that legislators have another resource for understanding the distribution of low-income families across the state and the extent to which child nutrition programs are especially relevant in their districts.
Wide Variation in FRPL Eligibility Across New Hampshire
Participation in the free and reduced-price lunch program supports the healthy development of eligible low-income children by providing nutritious lunches each school day. To be eligible for FRPL, children must live in families with incomes below 185 percent of the poverty guideline, translating in 2019 to about $48,000 for a family of four.1 Although not all eligible students actually receive FRPL, these data can serve as a proxy for “low-income” rates and nutrition risk at the local level. Figure 1 shows the FRPL eligibility rates for each House district, calculated as the share of students eligible for FRPL among all students whose school buildings fall within a given district.
Unsurprisingly, the distribution of FRPL-eligible students across the state follows established patterns of child and family poverty.2 Some of the highest FRPL eligibility rates are in northern Coös and in Carroll County, and some of the lowest rates are found in the southeastern Rockingham and Strafford Counties. However, there are significant disparities within counties. For instance, although the FRPL eligibility rates in most Coös districts hover around 40 to 50 percent, in Coös County District 6 (the Gorham-Shelburne area) the rate is about half that, at 22.4 percent. Similarly, most eligibility rates in Belknap County range from 20 to 34 percent, but Belknap County District 3 (Laconia) is considerably higher at 49.3 percent. The lowest eligibility rate is 2.5 percent in Rockingham County District 7 (Windham), and the highest rate is 82.6 percent in Hillsborough County District 12 (Manchester, Ward 5). The average FRPL eligibility rate across all schools for which the New Hampshire Department of Education reports data is 24.8 percent.
Policy Implications
Research finds that participation in the National School Lunch Program improves children’s health3 and can reduce food insecurity across the household by feeding children and freeing up resources that would have been used for children’s lunches.4 But ensuring that eligible children are identified and enrolled in FRPL is not always easy. Identifying eligible children relies on schools’ efforts, many of which are constrained by limited resources. An identification tool known as categorical eligibility—the automatic eligibility for FRPL among children of families who receive Temporary Assistance for Needy Families (TANF, also known as welfare) benefits or benefits under the Supplemental Nutrition Assistance Program (SNAP, also known as food stamps)—would be eliminated under a proposed federal rule. Although the Food and Nutrition Service notes that 96 percent of categorically eligible children would remain eligible under the new rule,5 all would need to apply. For families unused to having to submit this paperwork, children may experience gaps in, or even loss of, FRPL receipt.6
Beyond better identifying eligible children, child nutrition can be more broadly supported by reducing barriers to program participation and improving program delivery. For example, the U.S. Department of Agriculture does not require a minimum allotted time for lunch, but research shows7 that students regularly get less than the American Academy of Pediatrics recommendation of 20 minutes, which should exclude time to walk to the cafeteria and/or stand in line.8 Ensuring adequate time to make nutritious selections and fully consume lunch might improve participation in and consumption of school lunch. Legislators might also consider ways to strengthen other child nutrition programs, like school breakfast, which is consistently underutilized compared to participation in school lunch.9 Although New Hampshire recently expanded free school breakfast to all students previously eligible for reduced-price breakfast,10 the logistics of arriving at school in time to eat before class can be challenging. Models that allow “grab and go” breakfast, opportunities to eat inside the classroom, or “breakfast after the bell,” i.e., later in the morning, have been identified as effective for increasing participation in school breakfast.11
In summary, to support children’s access to school meals, legislators can use data such as the information offered in this brief to consider how to best ensure schools in their districts have the resources needed to identify, enroll, and serve children in need.

Data and Methods
An earlier version of the data for this brief was provided by New Hampshire Hunger Solutions. Data used here were obtained from the New Hampshire Department of Education’s attendance and enrollment reports, specifically FRPL eligibility rates by school. These data were then translated to the House district level using specialized geographic information systems (GIS) software. Data are collected as of October 1, 2019 and include only children in grades 1 through 12. Legislative district-level rates were calculated by totaling all FRPL-eligible students enrolled in schools that are physically located within a district and dividing that number by the total number of students enrolled in those same schools. Note that as student residence is not tracked in these data, rates are calculated among students enrolled in schools within a district, rather than students who necessarily live within the district.
FRPL eligibility data are not available for all schools. Cases where none of the schools in a legislative district report data are denoted with white shading in Figure 1. An example is Merrimack County District 17 (Concord, Ward 8), which contained only one identified school, Capital Christian School, for which no FRPL data are available. This is a private school operated by the Seventh-Day Adventist Church and, per the Department of Education, does not likely have any students who are FRPL-eligible. Additional information about specific House districts without data is available upon request from the authors. Because it could not be identified in the GIS software used, one school reporting FRPL data for 2019-2020—the Spark Academy of Advanced Technologies Charter School in Manchester—was excluded from this brief; the school had a total of twenty-six enrolled students, two of whom were FRPL-eligible. For visual clarity, Figure 1 does not include data for floterial districts, although those data are available upon request. Finally, not all schools that report a count of students eligible for FRPL participate in the National School Lunch Program (e.g., some charter schools).
Endnotes
1. See “National School Breakfast and Lunch Program for New Hampshire,” Benefits.Gov, https://www.benefits.gov/benefit/2004 and “2019 Poverty Guidelines”, 2019, Office of the Assistant Secretary for Planning and Evaluation (ASPE), https://aspe.hhs.gov/2019-poverty-guidelines. There are other ways through which children can be deemed eligible for FRPL, including categorical eligibility, though, as discussed in the text, a proposed federal rule would eliminate this method (“Broad-Based Categorical Eligibility and School Meals,” Food Research & Action Center (FRAC), October 21, 2019, https://www.frac.org/blog/broad-based-categorical-eligibility-and-schoo…). Children may also be eligible if their school participates in the community eligibility provision, whereby a high-enough share of students is deemed eligible that a school can file paperwork to have the entire student body deemed eligible. State stakeholders reported to the authors that for the 2019–2020 school year only three New Hampshire schools participate in this option (Winchester School, Stratford Elementary, and Bluff School).
2. For instance, see Andrew Schaefer, Jessica Carson, and Marybeth Mattingly, “Data Snapshot: Poverty Estimates for New Hampshire Counties,” Carsey School of Public Policy University of New Hampshire, October 30, 2017, https://carsey.unh.edu/publication/snapshot/poverty-estimates-nh.
3. Craig Gundersen, Brent Kreider, and John Pepper, “The Impact of the National School Lunch Program on Child Health: A Nonparametric Bound Analysis,” Journal of Econometrics, Annals Issue on “Identification and Decisions,” in Honor of Chuck Manski’s 60th Birthday, 166, no. 1 (January 1, 2012): 79–91, https://www.sciencedirect.com/science/article/abs/pii/S0304407611001205.
4. Katherine Ralston and Alisha Coleman-Jensen, “USDA’s National School Lunch Program Reduces Food Insecurity,” United States Department of Agriculture Economic Research Service, August 7, 2017, https://www.ers.usda.gov/amber-waves/2017/august/usda-s-national-school….
5. “USDA Prepares, Releases Requested Informational Analysis on School Meals Eligibility under Proposed SNAP Rule,” United States Department of Agriculture Food and Nutrition Service, October 15, 2019, https://www.fns.usda.gov/pressrelease/fns-001519.
6. The burden of increased administrative rules and procedures often restricts access to benefit programs or leads to unplanned exits, even for those who meet the eligibility criteria and would prefer to participate. See, for example, Evelyn Z. Brodkin and Malay Majmundar, “Administrative Exclusion: Organizations and the Hidden Costs of Welfare Claiming,” Journal of Public Administration Research and Theory 20, no. 4 (October 1, 2010): 827–48, https://doi.org/10.1093/jopart/mup046 and Pamela Herd and Donald P. Moynihan, Administrative Burden: Policymaking by Other Means (New York, New York: Russell Sage Foundation, 2018), https://www.russellsage.org/publications/administrative-burden.
7. Arianna Prothero, “Why 20-Minute Lunch Periods Aren’t Good For Students,” Education Week, October 14, 2019, https://www.edweek.org/ew/articles/2019/10/14/why-20-minute-lunch-perio…; “Education and Health in Schools: A Survey of Parents” (NPR/Robert Wood Johnson Foundation/Harvard School of Public Health, September 2013), https://media.npr.org/documents/2013/dec/rwjf_npr_harvard_edpoll.pdf.
8. “These Days, School Lunch Hours Are More Like 15 Minutes,” National Public Radio, December 4, 2013, https://www.npr.org/sections/thesalt/2013/12/04/248511038/these-days-sc….
9. “School Breakfast Program,” Food Research & Action Center (FRAC), https://frac.org/programs/school-breakfast-program.
10. Sarah Gibson, “New Law Expands Free School Breakfast Across N.H.” New Hampshire Public Radio, July 30, 2019, https://www.nhpr.org/post/new-law-expands-free-school-breakfast-across-….
11. Mary O. Hearst et al., “Altering the School Breakfast Environment Reduces Barriers to School Breakfast Participation among Diverse Rural Youth,” The Journal of School Health, 88 no. 1 (January 2018): 3–8, https://doi.org/10.1111/josh.12575; see also “2018–2019 State-Level Policy and Legislative Trends,” (No Kid Hungry, n.d.), http://bestpractices.nokidhungry.org/sites/default/files/2020-01/2018-19%20state%20legislative%20and%20policy%20trends%201820.pdf.
About the Authors
Sarah Boege is a policy analyst with both the Vulnerable Families Research Program and the Center for Impact Finance at the Carsey School of Public Policy.
Jess Carson is a research assistant professor with the Vulnerable Families Research Program at the Carsey School of Public Policy.
Acknowledgments
This brief was made possible with support from New Hampshire Hunger Solutions.
The authors thank Michael Ettlinger and Jordan Hensley at the Carsey School of Public Policy, MaryLou Beaver at Waypoint NH, and Elaine VanDyke at New Hampshire Hunger Solutions for feedback on an earlier draft. Additional thanks to Laurel Lloyd and Nick Gosling at the Carsey School for assistance with layout and digital production, to Barbara Cook at the Carsey School for mapmaking assistance, and to Patrick Watson for editorial assistance.