download the brief
Key Findings


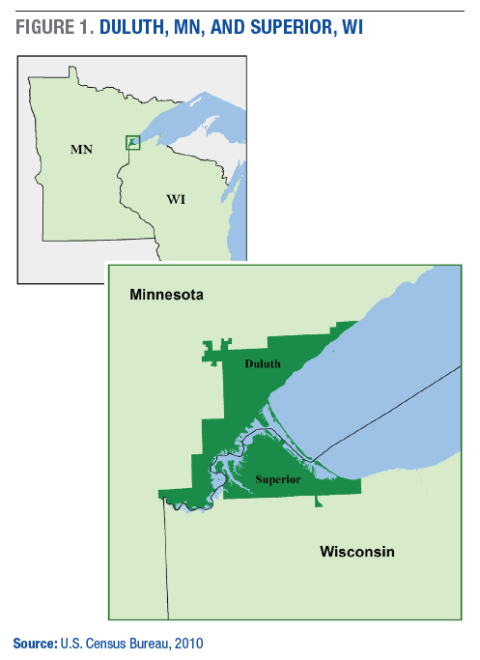
In this brief, we present a demographic and economic profile of Duluth, MN, and Superior, WI, with a specific focus on families with children. The cities, situated at the western point of Lake Superior (see Figure 1), share a rich economic history as major ports for coal, iron ore, and grain. Each city is also home to numerous colleges and universities, including the University of Minnesota-Duluth and the University of Wisconsin-Superior.
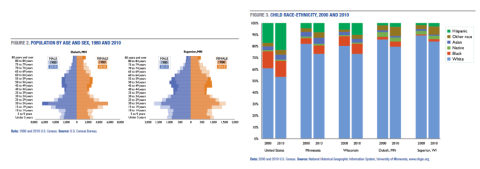
Like other U.S. cities home to large higher-education institutions, Duluth and Superior have benefited from a large influx of young people in their late teens to early twenties from surrounding suburbs and rural areas.1 As illustrated in Figure 2, between 1980 and 2010 each city experienced a large “bump” of college-age youth, many of whom have likely entered the cities in search of economic and/or educational opportunities. (We can conclude that the bump is the result of migration since these youth were not there as children in the 1980s). Figure 2 also shows that many of the young adults in each city left when they reached their late twenties and early thirties, an out-migration common in American cities.2 The influx of college-age adults and outflow of somewhat older adults leaves Duluth and
Superior with relatively low median ages compared to other places across the United States.
Duluth and Superior are like other cities in Minnesota and Wisconsin in terms of racial-ethnic diversity. In the 2010 Census, 89.5 percent of the population in Duluth and 90.6 percent of the population in Superior identified as white (Carsey analysis of Census data not shown). The child populations are slightly more diverse at 79.8 percent and 84.1 percent non-Hispanic white, respectively. Between 2000 and 2010 the population of most racial-ethnic minority groups increased in both Duluth and Superior, with the largest increases among those in the “other” race category, which includes people of two or more races. In the most recent period, children in the “other” group made up the largest share of the minority population in both cities (Figure 3).
With this demographic background in mind, we explore the economic backdrop of Duluth and Superior. We analyze data on family income and poverty and, wherever possible, compare conditions in Duluth and Superior to those in Minnesota, Wisconsin, and the nation as a whole.
Income and Poverty
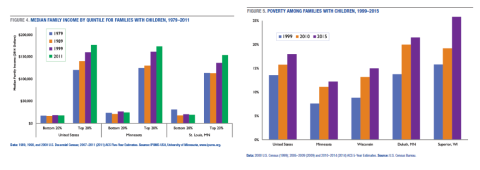
One way to assess financial progress for families with children is to observe median family income over time for families at the top and bottom of the income spectrum, as displayed in Figure 4 for 1979, 1989, 1999, and 2011. In the United States and in Minnesota, median family income for families with children stagnated between 1979 and 2011 for the bottom 20 percent of families; in St. Louis County, MN (see Box 1), it fell dramatically, from $30,904 in 1979 to $19,526 in 2011. Conversely, median family income in St. Louis County increased for those in the top 20 percent, from $113,625 in 1979 to $154,093 in 2011. The growth in the income gap between these families has been driven largely by increases in income
for families at the top and stagnation or decline for families at the bottom.
Poverty among families with children has climbed (Figure 5).3 Across the nation, about 13.6 percent of families with children were poor in 1999. As of 2015, 18.0 percent of these families were poor. The situation is somewhat worse in both Duluth and Superior. Approximately 21.5 percent (or about 1,900) of Duluth families with children were poor in 2015, compared to 13.7 percent in 1999. Similarly, 25.8 percent (or about 800) Superior families with children were poor in 2015, compared to 15.8 percent in 1999. Further, while family poverty rates in Duluth and Superior were similar to those across the nation in 1999, by 2010 and 2015 poverty among families with children was higher in Duluth and Superior than in the United States, Minnesota, or Wisconsin.
Summary, Implications, and Discussion
Like many cities across the United States, Duluth and Superior have experienced an influx of young adults in search of education and job opportunities, giving the cities populations that are younger than the national average. As with many other Midwestern cities, Duluth and Superior are also overwhelmingly non-Hispanic white, although the young racial-ethnic minority population is growing, particularly among those of college age and young children.
In terms of income and poverty, families with children in Duluth and Superior have experienced declines in income and increases in poverty in the past several decades. Median family income for those at the bottom of the income spectrum in St. Louis County, MN—home of Duluth—has stagnated or declined over the past 40 years. Similarly, in both cities poverty among families with children has increased since 1999 and has outpaced increases across the nation and statewide.
Trends in family income and poverty in Duluth and Superior are similar to trends found in the nation as a whole. Throughout the course of the Great Recession, median family income declined4 and child poverty increased5 substantially in most places in the United States, and many places have yet to return to pre-recession levels.6 Further, children in cities and rural places are far more likely to be poor than their suburban counterparts.7
While economic deprivation is harmful in that it signifies a family’s lack of financial resources, most estimates of living wages (which take into account a family’s basic needs) suggest that the poverty line underestimates families in need. For example, Massachusetts Institute of Technology’s living wage calculator suggests that a family of four with two adults and two children in Duluth, MN, requires about $66,445 in annual income before taxes to meet estimated expenses and $69,667 in Superior, WI.8 These estimated income values are almost three-times higher than the federal poverty threshold for the same family type in 2016 ($24,339). In addition, classifying families as “poor” obscures varying levels of severity of poverty among poor families and families just above the poverty line. About 40 percent of poor children in both Duluth and Superior, for instance, live in families with total incomes below half of their assigned poverty threshold (that is, less than $12,018 in 2015 for a household of four). Similarly, another 22 percent of children in both Duluth and Superior live in families defined as non-poor with total incomes below two-times the poverty line (that is, $48,072 in 2015 for a household of four) (Carsey analysis of ACS data not shown).
Further, poverty is particularly harmful to children under age 6. Although we do not analyze poverty rates for the young child population in this report, it is important to note the long-term negative impact that economic deprivation can have for this group. Children who experience poverty early in life, especially deep poverty, are at risk for deleterious physical and mental health outcomes, as well as lower cognitive and academic achievement scores and increased behavioral problems.9
Data
American Community Survey (ACS): The ACS is conducted by the U.S. Census Bureau. Each year, 1 percent of U.S. households are sampled and asked a variety of questions about each person living in that household. These questions include basic demographics like age, sex, race, ethnicity, and nativity, as well as economic-related questions like total family income from various sources, poverty, and employment status. For the area of interest, we use two five-year samples of the ACS, 2006–2010 (2010) and 2011–2015 (2015).
U.S. Decennial Census (Census): The Census is conducted by the U.S. Census Bureau. Every ten years, each household across the United States is asked basic questions about age, sex, race, and ethnicity. We use these data in our discussion of the age and racial-ethnic breakdown of the area of interest.
Box 1: Duluth–Superior Geography
For most analyses, we provide data on Duluth and Superior as defined by the Census Bureau and displayed in Figure 1. Due to data restrictions, however, some analyses require the use of larger geographic areas. In these analyses, we rely on the county that contains Duluth—St. Louis County, MN. Unfortunately, there is no data available for Douglas County, WI, home of Superior. These analyses are available only until 2011.
Endnotes
1. For a summary of trends in migration patterns, see R.L. Winkler et al., “County-Specific Net Migration by Five-Year Age Groups, Hispanic Origin, Race, and Sex 2000–2010,” Working Paper No. 2013-04 (Madison: Center for Demography and Ecology, University of Wisconsin—Madison, 2013).
2. Ibid.
3. Poverty is a family-level construct that compares total family income to a threshold based on number of adults and children in the family. If a family’s total income is below its assigned threshold, then everyone in the family is considered poor. For families of four with two adults and two children in 2015, the poverty threshold was $24,036.
4. Bernadette D. Proctor, Jessica L. Semega, and Melissa A. Kollar, “Income and Poverty in the United States: 2015,” Current Population Report P60-256(RV) (Washington, DC: Census Bureau, 2016).
5. Marybeth J. Mattingly, Jessica A. Bean, and Andrew Schaefer, “One Million Additional Children Live in Poverty Since 2009: 2010 Data Reveal Nearly One in Four Southern Children Now Live in Poverty” (Durham, NH: Carsey Institute, 2011).
6. Andrew Schaefer, Jessica Carson, and Beth Mattingly, “Overall Declines in Child Poverty Mask Relatively Stable Rates Across the States” (Durham, NH: Carsey School of Public Policy, 2016).
7. Ibid.
8. For more information on the calculation of living wages, see MIT’s living wage calculator: http://livingwage.mit.edu/.
9. See, for example, Jeanne Brooks-Gunn and Greg J. Duncan, “The Effects of Poverty on Children,” The Future of Children 7, no. 2 (1997): 55–71; J.D. McLeod and M.J. Shanahan, “Poverty, Parenting, and Children’s Mental Health,” American Sociological Review 58 (1993): 351–66; Jeanne Brooks-Gunn, T. Leventhal, and Greg J. Duncan, “Why Poverty Matters for Young Children: Implications for Policy,” in J.D. Osofsky and H.E. Fitzgerald, eds., WAIMH Handbook of Infant Mental Health: Vol. 3. Parenting and Child Care (New York, NY: Wiley, 1999); J.R. Smith, Jeanne Brooks-Gunn, and P.K. Klebenov, “The Consequences of Living in Poverty for Young Children’s Cognitive and Verbal Ability and Early School Achievement,” in G.J. Duncan and J. Brooks-Gunn, eds., Consequences of Growing Up Poor (New York, NY: Russell Sage, 1997); R. Gabriela Barajas, Nina Philipsen, and Jeanne Brooks-Gunn, “Cognitive and Emotional Outcomes for Children in Poverty,” in D.R. Crane and T.B. Heaton, eds., Handbook of Families & Poverty (New York, NY: SAGE Publications, 2007); and Randall K. Q. Akee et al., “Parents’ Incomes and Children’s Outcomes: A Quasi-Experiment Using Transfer Payments from Casino Profits,” American Economic Journal: Applied Economics, vol. 2, no. 1 (January 2010).
Acknowledgements
This work was funded by the Knight Foundation Fund of the Duluth Superior Area Community Foundation. The authors thank Curt Grimm and Michele Dillon at the Carsey School of Public Policy for feedback on earlier drafts of this brief, and Laurel Lloyd and Bianca Nicolosi for their layout assistance.