Key Findings


As in communities nationwide, the Upper Valley of New Hampshire and Vermont is faced with navigating the complexities of early childhood education and care,1 made worse by the COVID-19 pandemic. In this brief, we describe the early childhood education and care landscape of Grafton and Sullivan Counties in New Hampshire and Orange and Windsor Counties in Vermont, contextualizing those findings with comparisons to data from the pre-pandemic period of 2017.2
In 2021, there were 199 licensed and registered child care providers serving children under 5 in the Upper Valley with a capacity of 5,169 child care slots.3 The Vermont side of the border is home to a greater number of providers—115, compared to 84 in New Hampshire. However, because family-based care is more prevalent in Vermont, more providers doesn’t mean more slots, with 2,156 slots in Orange and Windsor Counties compared to 3,013 in Grafton and Sullivan. This distribution of slots across state lines generally matches the distribution of the Upper Valley’s young children, about 60 percent of whom live on the New Hampshire side of the border.
Although family-based providers were more prevalent in Vermont than in New Hampshire, center-based providers are more common on both sides of the border and dominate the regional landscape overall.
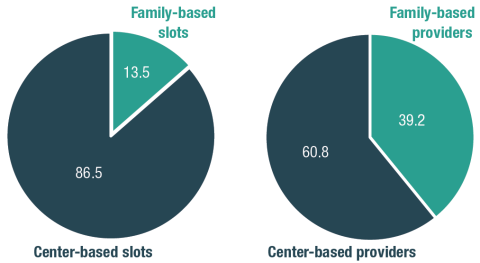
In 2021, the Upper Valley was home to 121 center-based providers and 78 family- or home-based providers. Because of their larger operating size, center-based providers accounted for 61 percent of the region’s providers, but 87 percent of its slots (Figure 1). Finally, while all 199 providers reported serving preschoolers, available care varied by child age: only 152 Upper Valley providers reported serving toddlers (76 percent) and just 129 (65 percent) served infants.
Figure 1. Distribution of Upper Valley Slots (left) and Licensed and Registered Providers (right) by Type, 2021 (percent)
Source: Carsey School of Public Policy analysis of licensing data from New Hampshire Child Care Licensing Unit and Vermont Child Development Division.
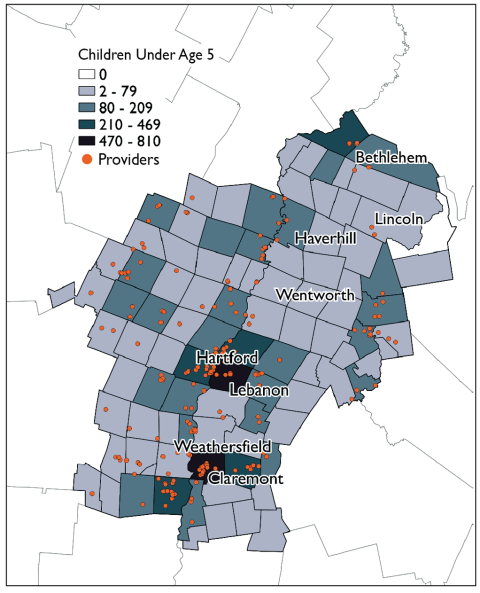
Figure 2 shows that the distribution of child care providers is not even across the region. Rather, providers are densely clustered at the border, and in the region’s most populous towns, including Claremont, Lebanon, and Hartford. On the Vermont side, providers are more evenly distributed across the region. Within towns, however, providers are often sited in population clusters: for instance, a concentration on the western, town-center side of Haverhill and a wider scatter across the two villages that make up Weathersfield.
On the New Hampshire side of the border in particular, this concentration of providers results in significant child care gaps across the map. For instance, families in the Wentworth region or parts of Lincoln and Bethlehem could experience substantial distances to reach a licensed or registered provider.
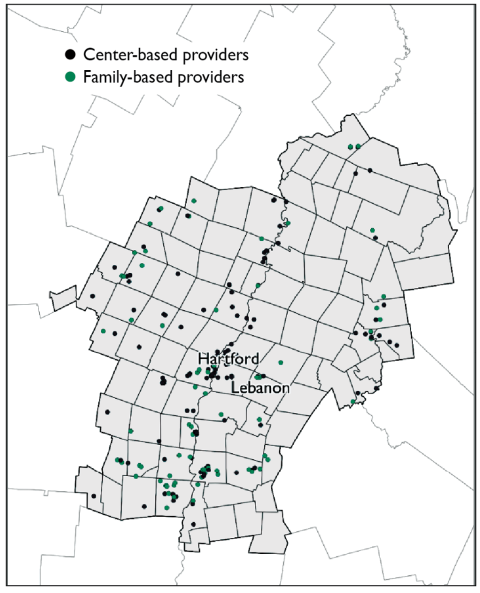
Along with the uneven geographic distribution of providers, the spatial mix of provider type suggests some gaps, again, particularly for New Hampshire families (Figure 3). While there’s a mix of providers in Hartford and Lebanon, it’s clear that those seeking family-based providers have fewer options north of Lebanon on the New Hampshire side and west of Hartford on the Vermont side. Although access to any care matters, just as crucial is access to the right type of care. For instance, families with non-traditional schedules or special care needs may seek family-based providers, who can often more flexibly meet these needs.
Along with the uneven geographic distribution of providers, the spatial mix of provider type suggests some gaps, again, particularly for New Hampshire families (Figure 3). While there’s a mix of providers in Hartford and Lebanon, it’s clear that those seeking family-based providers have fewer options north of Lebanon on the New Hampshire side and west of Hartford on the Vermont side. Although access to any care matters, just as crucial is access to the right type of care. For instance, families with non-traditional schedules or special care needs may seek family-based providers, who can often more flexibly meet these needs.
Figure 2. Estimated Distribution of Children Under Age Five and Licensed/Registered Child Care Providers in the Upper Valley, 2021
Source: Children under 5 estimated using state vital statistics. Provider data from New Hampshire Child Care Licensing Unit and Vermont Child Development Division.
Figure 3. Upper Valley Licensed/Registered Child Care Providers by Type and Location, 2021
Source: Carsey School of Public Policy analysis of licensing data from New Hampshire Child Care Licensing Unit and Vermont Child Development Division.
At the time of our last assessment in 2017, the Upper Valley had 224 licensed or registered child care providers; by 2021, the region experienced a net loss of 25 providers. Of Upper Valley providers that were open in 2017, 76 percent were still open in 2021, higher than the non-Upper Valley portions of either state (71 percent in New Hampshire and 65 percent in Vermont). Although the net change was not extreme, there is considerable turnover in the field, and between 2017 and 2021, in the Upper Valley 54 providers closed and 29 providers opened. In New Hampshire, Vermont, and the Upper Valley, family-based providers were more likely to shutter, closing at double the rate of centers. The loss of these family-based providers is part of a broader national trend and not only reflects reduced capacity, but also reductions in choice for families, particularly those seeking more flexible, affordable, or culturally tailored options.4
In both New Hampshire and Vermont, licensed capacity is determined based upon the square footage of available “safe useable space per child.”5 Vermont requires 35 square feet of indoor space per child for licensed centers, and New Hampshire requires 40 (unless licensed before November 23, 2008, for which it is 35 feet). Outdoor play areas are also subject to square footage requirements, at 50 feet per child for New Hampshire and 75 for Vermont.
Although licensed capacity indicates the maximum number of children allowed to occupy a space, this number does not necessarily align with the number of children providers can feasibly care for, given staff availability, nor with the adult-child ratios or groups sizes advisable for highest quality of care. As described below, there is evidence that both states enroll fewer children than licensing permits.
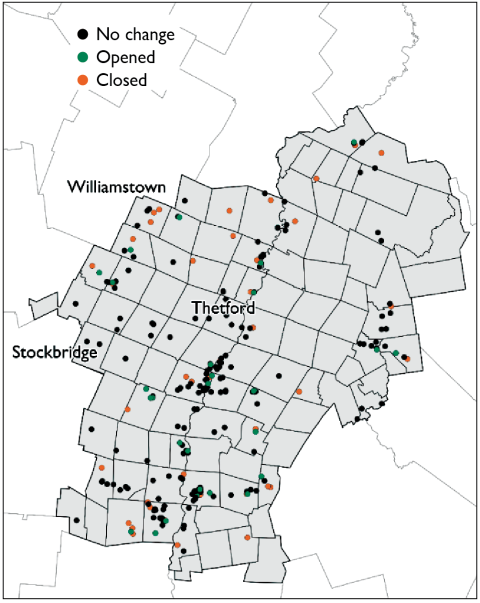
Figure 4 shows that some areas of the Upper Valley experienced greater provider stability than others. For example, across southern Orange County into northern Windsor County—from Thetford to Stockbridge—there were few changes, while Williamstown in northwest Orange County experienced a cluster of closures. Losses also appeared in northeastern Orange County and northwestern Grafton County, with some closures and only one new provider opening in this area.
Figure 4. Changes in Upper Valley Licensed/Registered Providers from 2017 to 2021
Source: Carsey School of Public Policy analysis of licensing data from New Hampshire Child Care Licensing Unit and Vermont Child Development Division
Total child care capacity—the number of child care slots—remained similar over time, with 5,203 slots in 2017 and 5,169 slots in 2021 (see Figure 5). Since providers with fewer-than-average slots were more likely to close and providers with more-than-average slots were more likely to open, the total number of slots stayed about the same.
Figure 5. Licensed and Registered Slots in the Upper Valley, 2017 and 2021, by Type
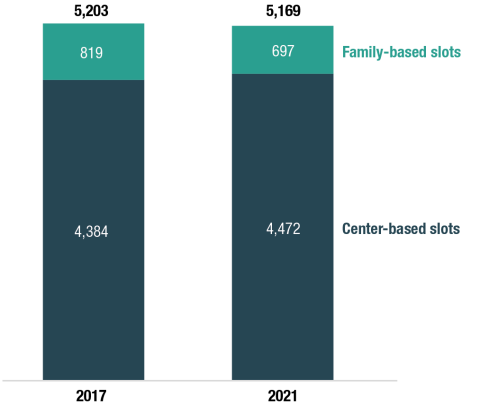
Note: Number of licensed and registered slots does not necessarily indicate the number of children who can be enrolled, due to staffing and other constraints. Source: Carsey School of Public Policy analysis of licensing data from New Hampshire Child Care Licensing Unit and Vermont Child Development Division.
In the last few years, the Upper Valley fared well in preserving child care slots. Some providers closed, but about half as many opened and the overall number of slots was relatively stable. However, records of licensed and registered child care slots only tell part of the story. Glaringly absent from these supply estimates are the contributions of informal or unlicensed child care providers, which contribute an unknown number of additional available slots.6 Moreover, the influence of staff shortages on the region’s licensed and registered supply is not accounted for here.
Workforce and staffing challenges are consistently identified as undermining providers’ ability to operate at full licensed capacity. New Hampshire’s most recent market rate survey, including providers statewide, revealed that providers wanted to enroll an average of 15 percent fewer children than their licensed capacity permits.7 In a March 2022 survey of center-based Vermont providers, 80 percent reported enrolling fewer children than desired and 86 percent reported that their program was experiencing a staffing shortage.8
Interviews with Upper Valley early childhood educators suggest this is still the case, reporting that workforce recruitment and retention challenges have limited their program’s ability to operate at desired capacity. In a December 2022 interview, one Upper Valley child care director estimated one-fifth of their program’s licensed slots were unfilled.
“We have about 20 open spaces where we can’t fill them, because we have to be so careful…We have that balancing act of ‘hire somebody, enroll a few kids. Hire somebody, enroll a few kids.’ But again, you have to be very cautious, because you could have three teachers out with the stomach bug the next day [leaving the center understaffed].”
Vermont’s earlier investments and strategic planning efforts have positioned the state to build on prior momentum. In 2023, its proposed legislation includes several activities that national early childhood education and care experts identify as “long-term” strategies for stabilizing the sector.9 These include further strengthening of the child care financial assistance program, creating infrastructure and funding to specifically reach historically underserved families with financial assistance, revamping subsidy reimbursement rates to align with the true cost of care, bringing early childhood educator pay into parity with public school teaching peers, and building workforce pipelines through access to no-cost four-year degrees.10
New Hampshire has laid groundwork on similar fronts, but with less intensity than Vermont. Legislators in New Hampshire may have a similar vision for the sector but without the extensive groundwork, the 2023 proposals thus far are moderate and more aligned with identified “short-term” strategies. These include, for instance, funding for recruitment and retention bonuses for the workforce, a revision of child care scholarship eligibility, and a small increase to reimbursement rates.11
This brief uses child care licensing data from the New Hampshire Child Care Licensing Unit and the Vermont Child Development Division (summer 2017 and summer 2021). For each state, the 2017 records were merged and matched with 2021 records to identify provider closures and openings. Providers were matched based on a combination of information including physical addresses, mailing addresses, owner names, and provider names. Partial matches were reviewed on a case-by-case basis using any matched information as context. For example, a case where the owner’s name differs but the physical address and business name is the same would be designated as a match (e.g., ownership may have changed, but the provider did not close).
For consistency across states and given data structure constraints, Vermont’s age group definitions were used to classify age groups served by providers in both states. Vermont child care licensing regulations specify that:
- “Infant” means a child who is at least six (6) weeks and under thirteen (13) months of age. (Section 2.2.25)
- “Toddler” means a child between thirteen (13) through thirty-five (35) months of age. (Section 2.2.62)
- “Pre-kindergartener” means a child who is thirty-six (36) months of age up until school age. (Section 2.2.36)
- “School age” means a child who is five (5) years of age or older and currently attending kindergarten or has completed kindergarten or a higher grade. (Section 2.2.46)
Quotations are drawn from interviews with child care providers in the Upper Valley collected by the Carsey School in 2022 and 2023, under a protocol reviewed and approved by the University of New Hampshire’s Institutional Review Board (UNH IRB #FY2023-27).
- Note that in this brief, we use the term “early childhood education and care” instead of the more widely used “early childhood care and education” per the Couch Family Foundation’s preference. This phrasing centers the educational nature of the sector’s work and underscores the educational expertise of its workforce.
- We use 2017 as the comparison period here since those data are the most recent that we have consistently available for both New Hampshire and Vermont. Because of our earlier work on child care in the region, we retained historical records of child care licensing in both states. At the outset of this project, we requested data from 2020 to provide a narrower examination of pandemic-related changes and learned that Vermont does not make available earlier versions of its licensing data. Since we already had custody of 2017 data, it necessarily became the pre-pandemic reference period.
- Note that there are an estimated 7,800 children under age 6 in the Upper Valley who live in a household where all available parents are in the labor force.
- See, for example, Jaimie Orland, Juliet Bromer, Patricia Del Grosso, Toni Porter, Marina Ragonese-Barnes, and Sally Atkins-Burnett. 2022. “Understanding Features of Quality in Home-Based Child Care That Are Often Overlooked in Research and Policy.” HBCCSQ Quality Features Brief OPRE Brief #2022-76. https://www.acf.hhs.gov/opre/report/understanding-features-quality-home-based-child-care-are-often-overlooked-research
- Vermont Child Care Center Based Regulations, 5.10.4.1. See also https://www.dhhs.nh.gov/programs-services/childcare-parenting-childbirth/child-care-licensing.
- Findings from the 2019 National Survey of Early Care and Education show that there are more than 5 million “unlisted” child care providers in the United States, providing at least 5 hours a week of care to children who are not their own. By comparison, there are 91,200 “listed” home-based providers—those who are licensed, regulated, exempt, or otherwise known to the state. The vast majority (79 percent) of unlisted providers are unpaid. See A. Rupa Datta, Carolina Milesi, Shivani Srivastava, and Claudia Zapata-Gietl. 2021. “NSECE Chartbook - Home-based Early Care and Education Providers in 2012 and 2019: Counts and Characteristics.” OPRE Report #2021-85, Washington DC: Office of Planning, Research and Evaluation, Administration for Children and Families, U.S. Department of Health and Human Services. https://www.acf.hhs.gov/opre/report/home-based-early-care-and-education-providers-2012-and-2019-counts-and-characteristics
- Michael Kalinowski, Fanny Kalinowski, and Isabella Kalinowski. 2021. “2021 New Hampshire Child Care Market Rate Final Report. New Hampshire.” https://www.nh-connections.org/uploads/2021-MR-FINAL-REPORT-2021-09-06-021.pdf
- Vermont Association for the Education of Young Children (VTAEYC). 2022. “Vermont’s Early Childhood Educator Staffing Crisis: Impact on Center-Based Child Care Programs.” https://www.vtaeyc.org/wp-content/uploads/2022/04/VTAEYC-ECE-Staffing-Survey-Results-April-2022.pdf
- Alliance for Early Success. 2020. “Build Stronger: A Child Care Policy Roadmap for Transforming Our Nation’s Child Care System.” https://earlysuccess.org/ChildCareRoadmap. Note that the Alliance is a network of early-childhood policy advocates at state and national levels. Two Let’s Grow Kids-affiliated advocates from Vermont are listed as “State Allies” in the “Build Stronger” report.
- See the introduced S.56: https://legislature.vermont.gov/Documents/2024/Docs/BILLS/S-0056/S-0056%20As%20Introduced.pdf
- See the introduced SB 237-FN: https://legiscan.com/NH/text/SB237/id/2660658/New_Hampshire-2023-SB237-Introduced.html
The authors are incredibly grateful to the early childhood educators in the Upper Valley who were willing to share their expertise and valuable time to help us better understand their needs. Additional thanks to state administrators in New Hampshire and Vermont who entertained our data requests, to Carsey School staff Kamala Nasirova and Ben Hammer for research support, and to Laurel Lloyd and Bailey Schott at the Carsey School for layout and communications support.

This work was made possible through generous funding and partnership from the Couch Family Foundation.

This brief is part of a series of work funded by the Couch Family Foundation aiming to explore the early childhood education and care landscape of the Upper Valley. See the Related Links for the other two briefs in this series.

Sarah Boege, MPP, is a senior policy analyst with the Center for Social Policy in Practice at the Carsey School of Public Policy. Sarah supports Carsey research through data collection and analysis, GIS mapping, and translating and disseminating research findings. At the core of their past and current work is the use of research to inform more equitable and accessible policy, practice, and decision-making.

Jess Carson, PhD, is the director of the Center for Social Policy in Practice and a research assistant professor at the University of New Hampshire’s Carsey School of Public Policy. Jess studies how policy affects people, focusing on how legislative and administrative decisions shape access to resources available through work, the social safety net, and community settings.
