Key Findings
Nationwide, over half a million children live in households that report very low food security among children, meaning a child is not eating enough, going hungry, skipping a meal, or not eating for a full day because the household can’t afford food. School meals fill an important gap in meeting household food demand during the week but cannot meet needs outside of school hours. To mitigate food insecurity on days when free school meals are unavailable, foodbanks have partnered with schools to create weekend feeding, or “BackPack,” programs that provide children with a bag of nonperishable food to nourish them over the weekend. These programs have grown rapidly since their inception at a single Arkansas elementary school in 1995, now serving more than 450,000 children just through Feeding America’s national network of foodbanks alone.1
This brief summarizes our recently published article at the Economics of Education Review, which aimed to understand how these BackPack programs relate to academic success. This research uses data from Northwestern North Carolina tracking the first adoptions and subsequent rapid growth of the BackPack program across schools there. We combine these participation data with restricted administrative student and school data, which allow us to observe how economically disadvantaged students in schools with and without such programs performed on end-of-grade tests in reading and mathematics.
We observe schools both before and after program adoption as well as schools that never adopt and further compare economically disadvantaged students (who are likely to benefit from the program) and their non-disadvantaged counterparts. As discussed in the data and methods section, our empirical approach uses all three of these differences (before vs. after adoption, participating vs. non-participating schools, and disadvantaged vs. non-disadvantaged students). Results provide strong evidence that the introduction of the BackPack program resulted in increased end-of-grade reading test scores for economically disadvantaged primary school students. We observe smaller increases in end-of-grade math scores following program initiation. The impacts on both reading and math appear strongest for the youngest and lowest performing students.
The BackPack Program in Northwestern North Carolina
Our study area encompasses 12 counties that are served by a single Feeding America affiliated foodbank, Second Harvest Food Bank of Northwest North Carolina (SHFB). The region of our study, depicted in Figure 1, includes a mix of different types of communities, ranging from the agricultural piedmont, Appalachian counties, and the urban centers of Greensboro, Winston-Salem, and High Point. The geographic and socioeconomic diversity of the region, along with the inclusion of urban areas, suggests that this study has relevance for many communities across the United States. Median household incomes, as well as measures of racial and ethnic diversity, in these North Carolina counties are typical of many U.S. counties. As illustrated in Figure 2, BackPack programs expanded rapidly in this region during our study period. Among these schools, participation increased from four programs initiated in the 2008–09 school year (which for simplicity we refer to as 2009) to 36 schools with a program by 2013.
Figure 1: Backpack Program in Northwestern North Carolina
Source: Author analysis of SHFB and NCERDC data; adapted from Kurtz, Conway, and Mohr (2020).
Figure 2: Percent of Eligible Schools with Backpack Program in Northwestern North Carolina, 2009 to 2013
Source: Author analysis of SHFB and NCERDC data; adapted from Kurtz, Conway, and Mohr (2020).
Results
Results show that presence of a BackPack program leads to a .09 standard deviation increase in reading scores for economically disadvantaged students in that school. The effect identifies the impact on the entire population of children that potentially participated in the BackPack program, i.e. all economically disadvantaged children at participating schools. In our data the percentage of economically disadvantaged children who participate in the program ranges by school and year from 10 percent to 30 percent. Therefore, our estimates are likely conservative relative to the true (and unobservable with our data) impact on the children who actually participated in the program.
Additional specifications, depicted in Figure 3, identify the impact of the BackPack program on test scores for cohorts of students subsequent to the adoption year. Square dots indicate the estimated magnitude of having a BackPack program that was adopted either one, two, or three years ago. Because the squares represent estimates, each square is accompanied by a bar that depicts the range of statistically probable effects. The figure shows a clear and similar pattern for both reading and math scores. The introduction of a BackPack program improves end-of-grade test scores for economically disadvantaged students. The magnitude of this improvement persists, and perhaps even grows, in the years after adoption.
Figure 3: Impact of BackPack Program on Reading and Math Test Scores
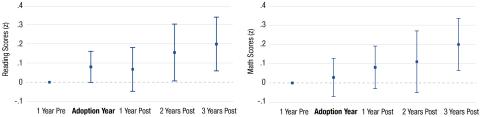
Note: Square dots represent estimated impacts and bars represent 95% confidence intervals. Source: Author analysis of SHFB and NCERDC data; adapted from Kurtz, Conway, and Mohr (2020).
To see if the impact differs by gender, race, grade level, or prior measures of academic performance, we analyze the data separately for different groups. Economically disadvantaged girls and boys both benefit from BackPack programs, although results suggest stronger effects for math scores among girls and stronger effects for reading scores among boys. By race, the positive effects on test scores are no longer evident in estimations using a sample of nonwhite students, even though our population of students is 74 percent nonwhite. This result is surprising and merits further study. Recall that the estimated impact is measured for all economically disadvantaged students, not just those who get food over the weekend. The smaller effect for nonwhite students can be due to limited availability, lower participation rates, or less impact for those students who do participate.
The effects differ strongly by grade level and prior performance, as shown in Figure 4. Breaking out the sample by grade level, we find that the beneficial effects on reading scores are most pronounced for 3rd graders, the youngest students in our sample. As a final exploration, we identify those 3rd graders with the lowest test scores (the bottom third). We then estimate the impact of having a BackPack program in the 4th or 5th grade for those students. Results show that these low-performing students benefit the most from the BackPack program, with statistically significant increases in both math and reading scores that are about twice as large as our estimate for the full sample.
Figure 4: Effect of BackPack Program on End of Grade Test Scores
Note: Asterisk (*) denotes statistical significance. Source: Author analysis of SHFB and NCERDC data; adapted from Kurtz, Conway, and Mohr (2020).
Discussion
Our results suggest that BackPack feeding programs lead to improvements in reading and, to a lesser extent, math scores. Benefits are particularly pronounced for the lowest performing students and persist over the limited period we observe. The impact to test scores is estimated using standard deviations. This measure accounts for differences in test scores across grades and years and makes our results easily comparable to other research findings, which typically use the same metric. These impacts are similar to those found for other nutritional interventions in prior research (e.g. increasing the quality or accessibility of school breakfast programs).2 They are also substantial relative to the performance gap experienced by economically disadvantaged (ED) students. To illustrate, when BackPack programs first began in our sample in 2009, the gap in average reading (math) scores between ED and non-ED 3rd graders was approximately 8.2 (6.1) points.3 Our estimated, baseline .09 standard deviation improvement in reading and .07 standard deviation improvement in math translates to 1.2 and 0.95 point increases, respectively, or about 15 percent of the performance gap. Given that BackPack programs are relatively inexpensive and are supplemental to the nutritional assistance already provided by schools and government, the findings highlight a potentially important new avenue by which nutritional assistance can benefit the academic performance of economically disadvantaged children.
How a BackPack Program Works
To bring the BackPack program to a new school, SHFB required that the school has a community partner, often a church. The community partner must commit to sponsoring at least 50 students and assumes the responsibility for packing, storing, and delivering food packs to the school. School employees then assist with distribution. During our sample period, the cost of food was about $5 per pack, which corresponds to $10,000 to provide 50 packs for the 40 weekends of a school year. Each pack contains two servings of grains (usually cereal), three servings of packaged fruit or juice boxes, two servings of protein, two servings of milk, and one serving of vegetables.
Data and Methods
Student and school data come from administrative files maintained by the North Carolina Education Research Data Center (NCERDC) at Duke University. These data include each student’s end-of-grade test scores in math and reading. Tests are administered at the end of each school year, beginning with the 3rd grade. To allow comparability across grades and school years, we redefine each student’s test scores to be standard deviations from the North Carolina state average for that student’s grade and year. The 2007–13 period used in this study includes data starting 2 years prior to the introduction of the first BackPack programs in the region in 2009.
The study uses a difference-in-difference-in-difference (DDD) empirical strategy that isolates the unique effect on an ED student of having a BackPack program at their school. This DDD strategy starts by analyzing how the performance gap between ED and non-ED students changes after a program is adopted, since only ED students are likely to participate in the program (a difference-in-difference). To isolate the program’s effect from other factors that could be affecting this change in the gap, we compare it to the change in the gap in schools that did not adopt the program over the same time period (“control” schools, for a third difference). Using statistical analyses, we further control for other student, school, and community characteristics that might correlate to test scores (e.g., age, gender, race, and resources available to the school).
This brief presents findings from a paper published by the authors in the Economics of Education Review. See Kurtz, M. D., Conway, K. S., & Mohr, R. D. (2020). Weekend feeding (“BackPack”) programs and student outcomes. Economics of Education Review, 79. https://doi.org/10.1016/j.econedurev.2020.102040 for more on the methods and additional findings from this work. The article, selected as “Best Paper” by the Economics of Education Review, is available by open access through December 2021.
Endnotes
1. See https://www.feedingamerica.org/our-work/hunger-relief-programs/backpack-program. While Feeding America is the largest sponsor of such programs, many communities nationwide are served by local organizations—such as End 68 Hours of Hunger—whose weekend feeding programs may differ slightly from Feeding America’s.
2. Cotti et al. (2014) study the amount of time elapsed between the receipt of SNAP benefits and the day of a standardized test, https://doi.org/10.1016/j.econedurev.2018.06.007.
Imberman and Kugler (2014) study schools that offer school breakfast in the classroom instead cafeteria, https://doi.org/10.1002/pam.21759.
Frisvold (2015) analyzes the impact of new state mandates to provide school breakfast. Frisvold, D. E. (2015). Nutrition and cognitive achievement: An evaluation of the School Breakfast Program. Journal of Public Economics, 124, 91–104.
Gordanier et al. (2019), https://papers.ssrn.com/abstract=3333530, and Schwartz and Rothbart (2020), https://doi.org/10.1002/pam.22175, estimate the impact of universal free lunches.
In all cases, the expected impacts are similar in magnitude to the ones we find for the BackPack program.
3. The observed range in reading (math) test scores is 65 (69) points, such that the 6–8 point gap reflects 10–12 percent of the range in test scores.
About the Authors
- Michael D. Kurtz is an Associate Professor of Economics at Lycoming College.
- Karen S. Conway is the John A. Hogan Distinguished Professor of Economics at the University of New Hampshire.
- Robert D. Mohr is an Associate Professor of Economics at the University of New Hampshire.
Acknowledgments
The authors thank Michael Ettlinger for helpful comments and Jess Carson and Laurel Lloyd for editorial assistance. We are grateful to Nikki McCormick of Second Harvest Food Bank as well as various other food bank, weekend feeding program, and school system personnel and volunteers for sharing data and institutional insight.