download the brief
Key Findings

Between 2014 and 2015, child poverty fell for all race-ethnicities except Asians.


In 2015, for the second year in a row, child poverty rates declined in the United States. However, familiar patterns in levels and characteristics of child poverty persist: more than one in five children are poor; children of color are at disproportionate risk for poverty; and rates are highest in the South and West and in rural areas and cities (Table 1).
This brief uses data from the American Community Survey to investigate patterns of child poverty across race-ethnicities and across regions and place types. We also explore changes in child poverty rates since 2014 and since the end of the Great Recession in 2009. The estimates presented in this brief are based on the official poverty measure (see Box 1 on page 3). Native Americans, Alaskan and Hawaiian natives, and those reporting multiple racial-ethnic backgrounds are excluded from this update because such samples are too small for meaningful analyses.
Nationwide, child poverty is highest among black children (36.5 percent), with rates nearly three times as high as those among non-Hispanic white and Asian children (12.5 and 12.1 percent, respectively). Rates among Hispanic children are also higher than those of white and Asian children, at 30.5 percent. These gaps persist despite the fact that between 2014 and 2015 black and Hispanic children experienced some of the largest declines in poverty. In other words, although poverty fell among these groups, thus narrowing the gap in rates between white children and children of color, these groups’ poverty rates are far from converging. For both black and Hispanic children, poverty rates are similar to the levels of 2009, when the recession ended, while rates for non-Hispanic white children remain slightly elevated (although consistently trending downward toward post-recession levels).
Regionally, poverty rates are highest for black children in the Midwest and South (43.2 and 36.0 percent, respectively) and for Hispanic children in the Northeast (33.3 percent). By place type, black child poverty is highest in rural places—driven by very high rates in the rural South—and Hispanic child poverty is highest in cities, largely due to its high incidence in the Northeast.
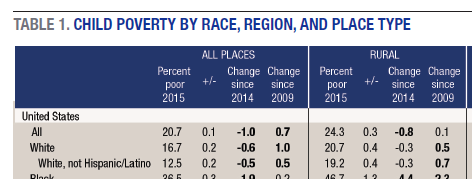
To view Table 1, please download the PDF.
Implications
These persistent place-based and regional disparities in child poverty suggest considerable variation in the social and economic conditions faced by children of color. As child poverty differs in its characteristics and experiences across the country, policies should consider the ways that place affects the conditions that lead to child poverty, the experience of living in poverty, and how poverty alleviation efforts may play out.
Given the well-established connection between child poverty and brain development, educational attainment, later labor market participation, and long-term health outcomes, the high incidence of place- and race-based child poverty in the United States is of particular concern. Closer attention to these disparities may nudge policy makers to think carefully about the context of place in efforts to alleviate poverty and increase youth opportunity.
Data
This analysis is based on estimates from the 2009, 2014, and 2015 American Community Survey. Tables were produced by aggregating information from detailed tables available on American FactFinder (http://factfinder.census.gov). These estimates give perspective on child poverty, but they are based on survey data, so caution must be exercised in comparing across years or places because seemingly disparate estimates may fall within margins of error. All differences highlighted in this brief are statistically significant (p<0.05).
The official poverty measure is a family-level construct that compares a family’s total income to a threshold based on number of adults and children in the family. If a family’s total income falls below its assigned threshold then it considered is poor, or in poverty. If a family is poor then everyone in the family is counted as poor. More sophisticated measures of economic well-being (like the Supplemental Poverty Measure) can assist in assessing child poverty in more nuanced ways, although it is worth noting that black and Hispanic children have higher poverty rates than their white and Asian counterparts, regardless of the measure used.
Box 1: Definitions of Place Type: Rural, Suburb, and City
Definitions of rural, suburb, and city vary among researchers and the sources of data they use. Data for this brief are derived from the American Community Survey, which identifies each household as being within one of several geographic components. As used here, “city” designates households in the principal city of a given metropolitan statistical area, and “suburban” includes those in metropolitan areas but not within the principal city of that area. “Rural” consists of the addresses that are not within a metropolitan area.
Acknowledgments
This brief was funded by the Annie E. Casey Foundation and anonymous donors. The authors thank Carsey School colleagues Michele Dillon, Curt Grimm, and Amy Sterndale for their feedback on earlier drafts, and Laurel Lloyd and Bianca Nicolosi for their layout assistance. Additional thanks to Patrick Watson for editorial assistance.