Appendix Table 1: Child Poverty by Region & State, 2018
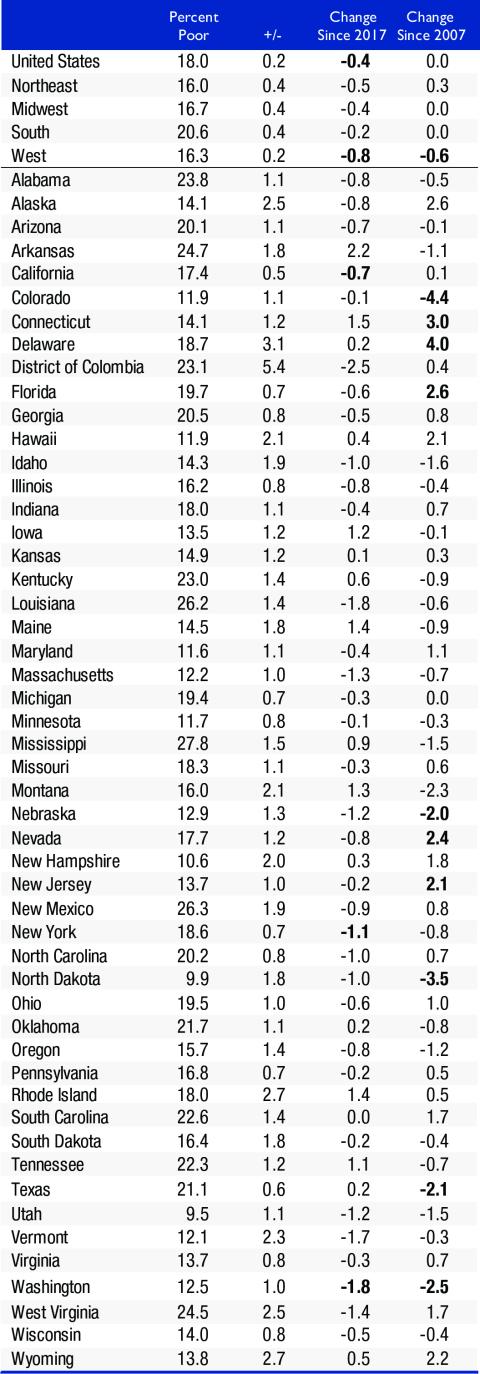
Note: Change is displayed in percentage points and based on unrounded percentages. Results may differ slightly from those that would be obtained using rounded figures. Bold font indicates a statistically significant change (p<0.05). Margins of error ("+/-") refer to the 95 percent confidence interval around the 2018 estimated percent poor.
Source: American Community Survey, 1-Year Estimates, 2007, 2017, and 2018.