download the brief
Key Findings
Population gains in New Hampshire have diminished over time, though growth has recently picked up.
Migration is the biggest driver of population change in the state.
The pattern of demographic change is uneven across the state.

New Hampshire’s population is aging.

New Hampshire is becoming more racially diverse, particularly among children.
New Hampshire’s future depends, in part, on the size, composition, and distribution of its population, including its age structure, racial-ethnic makeup, and migration patterns. For New Hampshire to thrive, policymakers, businesses, and nonprofits must be aware of the state’s population and demographic trends as they consider the needs of its people, institutions, and organizations. How, for example, will the state maintain economic growth as its population growth slows? How will an aging population manage its health care and lifestyle needs? How will employers attract workers with the educational credentials essential to productivity? Demography may not be destiny, but there is peril in ignoring it.
The Pace of Demographic Change in New Hampshire
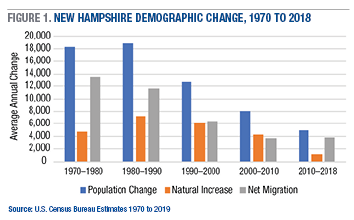
New Hampshire gained 40,000 residents (a 3 percent increase) between 2000 and 2018, and the population reached 1,356,458 on July 1, 2018, according to the Census Bureau. This recent growth, modest compared to the annualized gains in each of the previous four decades (Figure 1), is the result of two related but distinctly different demographic processes. The first is natural increase, which is the excess of births over deaths. Natural increase has contributed to overall population growth in New Hampshire throughout the state’s history, but it has diminished over the past several decades. With less natural increase, the state now depends increasingly on the second demographic component of change, net migration, which is the difference between the number of people moving into New Hampshire and the number leaving. Migration has long been important to New Hampshire, but it is far more volatile than natural increase and can change abruptly in response to shifts in the economy.
Natural increase peaked in the 1980s, when births exceeded deaths by 7,200 annually. Its contribution diminished after that and by 2010–2018 there were only about 1,000 more births than deaths annually. Although natural increase was significant in the boom decades of the 1970s, 1980s, and 1990s, migration accounted for the majority of the state’s population increase even then. For example, during the 1970s, when the state’s population grew by nearly 25 percent, migration accounted for nearly 75 percent of the gain. The slowdown in population growth during the 1990s was primarily due to dwindling migration gains. In the first decade of the twenty-first century, natural increase actually exceeded net migration as a source of the state’s modest population gain, due not to a surge in natural increase but to a precipitous slowdown in net migration. Net migration again accounted for most of the population growth between 2010 and 2018, though the population gain was far smaller than in the past.
Migration includes both domestic migration—the movement of people between locations in the United States—and immigration from abroad. Each of these components contributes to the overall migration gain or loss for the state. Through most of the past half century, domestic migration has fueled most of New Hampshire’s population gain: today, nearly 52 percent of the population of the state was born elsewhere in the country and later migrated to New Hampshire. In contrast, immigrants moved here from another country. Net immigration is the difference between the number of people coming into an area from outside the country and the number of people leaving the country from that area. Immigration was important to New Hampshire early in its history, and again at the turn of the twentieth century, but it has played a minor role in overall migration gains during the last half-century. Today, only 6 percent of New Hampshire’s residents are foreign born, compared to 13 percent of the U.S. population. Immigration played a more prominent role during the Great Recession and its aftermath not because it surged but because domestic migration diminished substantially. In recent years, domestic migration has rebounded, though not to the levels of earlier decades.
The Impact of the Recession on New Hampshire Demographic Trends
The long-term trends above show that both natural increase and migration have played important roles in the growth of New Hampshire’s population. However, population growth has been uneven recently from year to year. Between April 2000 and July 2003, the state gained an estimated 13,300 residents annually. But in 2007–2010, years roughly coinciding with the Great Recession, the annual population gain diminished to just 1,400, though it has recovered recently (Figure 2).

Why did the Great Recession have such a profound impact on the state’s demographic trends? In New Hampshire, as elsewhere in the United States, falling fertility rates during the downturn resulted in less natural increase—a fact reflected in the diminishing annual rates of natural increase in Figure 2. Recent research suggests that the fertility reductions that began during the recession are continuing. In contrast to this steady decline in natural increase, net migration was volatile during the recessionary and post-recessionary period. From 2000 to 2003, the net migration gain was 8,600, but by 2007–2010 the state had a net migration loss of more than 2,100 annually. This migration reversal occurred because during the Great Recession job losses, diminished retirement accounts, and a severe slump in housing prices froze people in place nationwide. As a result, states such as New Hampshire that have long enjoyed a net influx of migrants saw the inflow of new residents dwindle. As the Great Recession’s impact on New Hampshire began to wane, migration revived and population gains increased. By 2014–2018 the annual net migration gain was nearly as great as between 2000 and 2003. However, natural increase was minimal, so the population gain was considerably smaller than it had been just before the recession.
Recent Census Bureau estimates illustrate how much New Hampshire’s demographic trends have changed in the last few years. The state’s population grew by more than 7,000 annually between July 2016 and July 2018 (Figure 3), an increase 50 percent greater than between 2014 and 2016. Domestic migration accounted for nearly all the gain: the state had a net domestic migration gain of 4,300 annually between 2016 and 2018 compared to just 300 between 2014 and 2016 (there was a net domestic migration loss earlier in the decade). New Hampshire also received a net gain of 2,600 immigrants a year from other nations between 2016 and 2018, somewhat fewer than in the past. In contrast, births in New Hampshire now only minimally exceed deaths. Thus, natural increase has contributed little to recent population gains.
The diminishing contribution of natural increase to New Hampshire’s population growth is illustrated in Figure 4. In the 1970s, the 1980s, and particularly the 1990s, there were many more births than deaths in the state. In 1990, for example, 17,800 births and just 8,400 deaths produced a natural gain of 9,400. Births diminished over the rest of the decade before stabilizing at between 14,000 and 15,000 through 2007. Following the onset of the Great Recession, births diminished sharply in New Hampshire because fertility rates were low and the child-bearing-age population did not grow. Between 2011 and 2018, New Hampshire averaged just 12,200 births a year while deaths, which had slowly increased from 1980 to 2008, turned upward in 2009 because of population aging and rising drug-related mortality. The recent decline in births coupled with the uptick in deaths resulted in natural increase contributing just 200 additional people annually between 2016 and 2018.
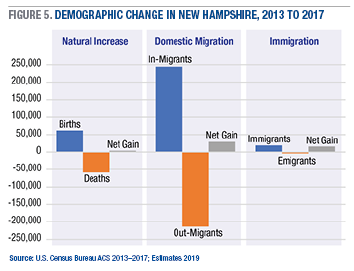
New Hampshire’s recent modest population gain could suggest that it has an immobile population. In fact, the state experienced significant turnover in all three demographic components between January of 2013 and December of 2017. Births exceeded deaths by just 3,300. Yet, it resulted from 119,000 vital events, including 61,000 births and 58,000 deaths (Figure 5). The streams of domestic migrants that produced a net gain of just 30,000 is the result of the movement of over 450,000 people. In all, 244,000 migrants moved to the state from other U.S. locations, while 214,000 left for other parts of the country. The volume of overall immigration is much smaller, an estimated 19,000 immigrants compared to 3,000 emigrants, but the net gain of nearly 16,000 to the state’s population was significant. Thus, though the net change in the state’s population was modest at just 49,000, nearly 324,000 of the state’s current residents were not here five years ago, and 275,000 who were here are now gone. This is considerable turnover in a state with a population of just 1,356,000.
Demographic Change Is Spatially Uneven Across New Hampshire
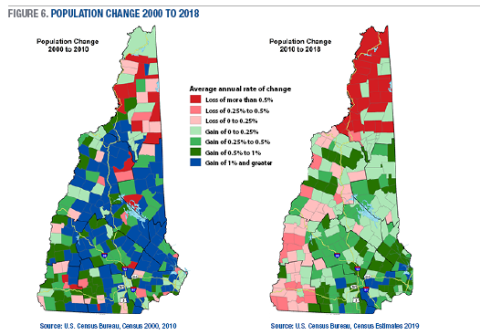
The pace of population change in New Hampshire is geographically uneven. Many fast-growing areas are concentrated in the southern and central parts of the state (Figure 6), while slower growth or population loss characterizes the northern part of the state and the area along the Connecticut River. Population gains in New Hampshire are stimulated by two factors. The first is the peripheral sprawl of the Boston metropolitan area: population growth rates are high in a broad band around the outer edge of the Boston metro, including much of southeastern New Hampshire. The second is the attraction of recreational areas in central New Hampshire. The selective deconcentration of population in the state is consistent with national trends, which show high growth in lower-population-density recreational areas and along the urban edge coupled with population stagnation or loss in remote lower-population-density areas that depend on extractive industries such as forest products, farming, and mining. The data also show that, though population growth diminished across the state between 2010 and 2018 compared to 2000 to 2010, the patterns of population redistribution are consistent. Areas with population growth between 2000 and 2010 were more likely to be growing after 2010, but population gains were smaller. In contrast, areas that lost population or grew slowly between 2000 and 2010 were more likely to lose population, or gain less, in the later period.

Population changes occurring in three New Hampshire counties further demonstrate how spatially uneven demographic change has been (Figure 7). Carroll County, an amenity-rich area easily accessible from large urban centers in southern New England, grew substantially over each of the last several decades because of its appeal to amenity migrants. Growth slowed considerably between 2010 and 2018, but Carroll still showed a modest population gain during the period. The entire gain was fueled by net migration, which offset the excess of deaths over births.
In northernmost Coös County, wood and paper products were long the mainstays of the local economy, with large mills employing generations of residents who processed the timber of the vast northern forests. Today, the mills are largely gone, and the county lost population between 2010 and 2018, primarily because deaths exceeded births. Yet Coös County is also situated in a scenic region with ski areas and grand old resorts that have welcomed generations of vacationers and now amenity migrants. There are efforts underway to facilitate more regional cooperation to attract new business and migrants to these areas, and so their demographic future remains in flux.
Hillsborough County, with 415,247 residents in 2018, is the most populous in the state. It includes the state’s two largest cities—Manchester and Nashua—as well as a substantial suburban population, and over the past several decades the proximity of both cities to the Boston metropolitan area has contributed to their growth. Between 2010 and 2018, Hillsborough County grew modestly because there were more births than deaths in the county and a modest net migration gain.
New Hampshire’s Changing Age Structure

New Hampshire is growing older. The ranks of adults in their 50s, 60s, and 70s has expanded substantially over the past 15 years, reflecting the aging of the state’s large baby boom population (Figure 8). In contrast, both the cohorts of children (age 0–19) and their parents (30–49) has diminished. The population age 20–29 grew modestly, in part because the large birth cohorts of the early 1990s are now in their 20s.
Because New Hampshire’s age structure has significant long-term policy implications, it is important to examine it (Figure 9). One important consideration for policymakers is that the number of older adults will increase rapidly in the next two decades. In 2015, the two large baby boom cohorts in their 50s (219,000 residents) and the two in their 60s (170,000 residents) represented nearly 30 percent of New Hampshire’s population. These cohorts were considerably larger than the population age 70–79 in 2015. Although mortality will modestly diminish these baby boom cohorts over the next few years, the vast majority will celebrate their 70th birthdays in New Hampshire. As a result, the state’s older population will more than double over the next 20 years.
In contrast, the cohorts that were age 25–44 in 2015 comprise considerably fewer people, primarily because of the lower birth rates of the 1970s and 1980s. As the large baby boom cohorts continue to disengage from the labor force, New Hampshire is likely to face significant challenges maintaining or expanding its labor force to support a growing economy unless the existing population is supplemented by additional migration.
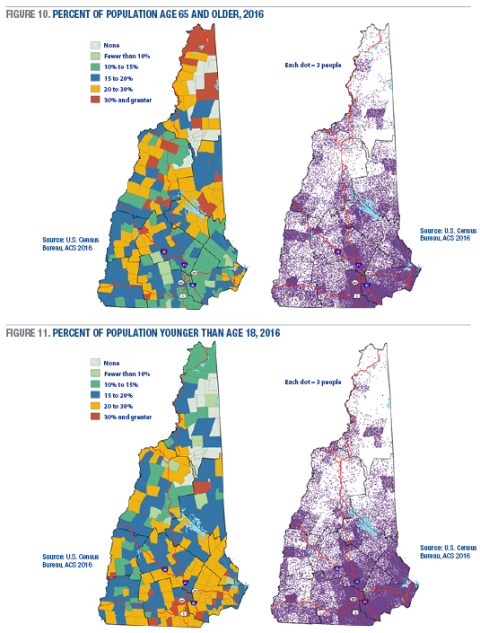
These age-structure shifts are not occurring evenly across the state. Northern and central New Hampshire have a substantially larger proportion of residents age 65 and over than do other parts of the state (Figure 10). Much of this pattern is a function of aging in place among current residents of these regions, coupled with a continuing loss of young adults. In some areas there has also been an inflow of older migrants. In these regions, local governments and organizations are the first to confront the challenge of an aging population. However, although the proportion of older adults is larger in the north, the vast majority of older adults reside in southern and central New Hampshire. In contrast, children represent a significantly larger part of the population in southeastern New Hampshire, both proportionally and in absolute numbers (Figure 11). The largest concentrations reside near the Massachusetts border. Because this region represents the outer edge of the Boston suburbs and includes Manchester, Nashua, and the Seacoast region, it attracts and retains a significant family-age population. Here, funding school construction and infrastructure expansion is likely to be a matter of more immediate concern than in the northern areas of the state.
Aging in place is the most powerful influence on New Hampshire’s age structure, but it is not the only factor. The age structure is also influenced by the age-specific migration streams into the state, and in this regard there are contrasts between the era of the Great Recession and more recent years. Historically, New Hampshire has received significant net inflows of people in their 30s and 40s together with their children, and it has received modest inflows of older adults. Migration patterns among those in their 20s have been uneven, however; indeed, the state lost modest numbers of 20-29-year-olds during the 1990s and 2000s.

As we have seen, New Hampshire recently began to receive a significant net inflow of people from other U.S. states. Compared to the recessionary and post-recessionary period of 2008–2012, the increase was greatest among those in their 20s, for whom migration gains averaged 1,200 a year between 2013 and 2017 compared to an average loss of 1,500 annually from 2008 to 2012 (Figure 12). Among those in their 30s, the net annual migration gain nearly doubled during the same period, while the net inflow of those age 40–49 diminished slightly. As more family-age adults migrated to New Hampshire again, their children fueled a significant net influx of those under age 20. These recent domestic migration gains are modest compared to earlier time periods, but they contrast with those during the time of the Great Recession. (Note that these data are based on Census Bureau estimates and as such should be viewed with caution; a definitive analysis of age-specific migration patterns to the state will not be possible until the results of the 2020 Census are available.)
Migration is important to New Hampshire’s future because it brings in younger people of working age at a time when the state’s workforce is aging. Moreover, in-migrants to New Hampshire have been better educated than those leaving and thus increase the state’s store of intellectual capital. Between 2013 and 2017, approximately 16,000 individuals with a bachelor’s degree or higher moved to the state annually (Figure 13). In contrast, roughly 11,500 individuals with similar academic credentials moved out. Even during the worst of the recession, New Hampshire had a net gain of migrants with a college degree or more, but the state’s gain has accelerated in the post-recessionary period.
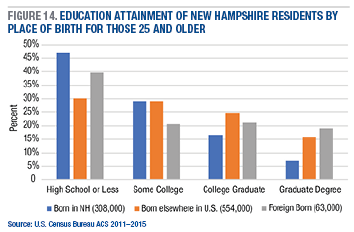
New Hampshire is often characterized as a state where residents’ lineage goes back generations, but in reality it has one of the most mobile populations in the country. Only 42 percent of the state’s residents were born in New Hampshire, far less than for New England (58 percent) or the United States (59 percent). Among those over the age of 25, only one-third were born in the state. Most of these adult migrants to the state (90 percent) were born elsewhere in the United States, and they bring in significant human capital. Compared to New Hampshire-born residents, both U.S.-born and foreign-born migrants are more likely to have a college degree and are nearly twice as likely to have a graduate degree (Figure 14). Thus, the recent upturn in migration brings more talented migrants to a state concerned about its aging labor force.
Recent New Hampshire Diversity Trends
Though New Hampshire remains far less diverse than much of America, diversity is growing here. In 2018, 90.0 percent of the state’s population was non-Hispanic white (hereafter white), making New Hampshire one of the nation’s least diverse states. Nationally the white population declined from 69.1 percent to 60.4 percent, a drop of 8.7 percentage points, between 2000 and 2018, while in New Hampshire the share dropped from 95.1 percent to 90.0 percent, a decline of 5.1 percentage points. But that shift meant a doubling of the proportion of the state that is minority, from 61,600 in 2000 to 136,000 in 2018, and this growth accounted for two-thirds of the small increase in the entire population.
With 52,700 residents, Hispanics make up 3.9 percent of the population and are the largest minority. The Asian population numbers 40,000 (2.9 percent of population) and African Americans 19,100 (1.4 percent). Each of these three groups nearly doubled in size between 2000 and 2018. Other minority groups, including Native Americans and those of multiple races, make up the remaining 1.8 percent of New Hampshire’s population.
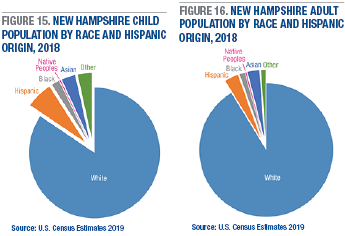
Children are in the vanguard of the state’s growing diversity, due predominantly to the decline in births among whites. In all, 15.5 percent of New Hampshire’s children belonged to a minority population in 2018 (Figure 15). The greater diversity among children is the result of two diverging trends: the minority child population grew by 19,700 between 2000 and 2018, while the white child population declined by 71,100. Because the minority youth gain was not sufficient to offset the white loss, New Hampshire’s child population declined by 51,400.
The proportion of the adult population that is minority (8.7 percent) is considerably smaller than among children (15.5 percent). Hispanics were the largest of these groups, followed by Asians and African Americans (Figure 16). As we look to the future, the proportion of New Hampshire’s population that is minority will likely continue to grow, for several reasons. For one, 19.4 percent of the white population is over age 65, compared to 6.7 percent of the minority population. Since mortality rates are higher for older adults, the high proportion of older whites will mean higher numbers of white deaths than minority deaths in the future. For another, only 24 percent of white women are of prime child-bearing age (20–39) compared to 32 percent of minority women. Though there are far fewer minority women than white women in New Hampshire, the larger proportion of minority women of prime child-bearing age increases the proportion of minority births.
Diversity is geographically uneven in New Hampshire. Large areas of the state have little diversity, but minorities represent a significant part of the population in the Concord-Manchester-Nashua urban corridor as well as in the Hanover-Lebanon region and in a few areas of the Seacoast. This is especially true among the child population: in Manchester and Nashua, more than 30 percent of children are minority.
Conclusion
The future economic and social well-being of New Hampshire communities depends on their ability to anticipate change and respond appropriately. Though New Hampshire is a relatively small player on the nation’s huge demographic stage, there is much to learn from an analysis of the way the state’s population is growing and changing. The purpose of this demographic analysis is to inform policy and to contribute to the efforts of policymakers, planners, nonprofits, and businesses to consider the future needs of New Hampshire’s people, institutions, and organizations in ways that will allow the state to continue to grow, prosper, and be a good place to live and raise families.
Methods
Data are from the Census Bureau, including the 1990, 2000, and 2010 decennial Censuses as well as intercensal population estimates for 2010–2018 released in 2019. Additional data are from the American Community Survey five-year datasets. Because some of the data are based on estimates or samples, readers should be cautious in interpreting these results.
About the Author
Kenneth M. Johnson is senior demographer at the Carsey School of Public Policy, Class of 1940 Professor of Sociology at the University of New Hampshire, and an Andrew Carnegie fellow (ken.johnson@unh.edu).
Acknowledgments
This research was supported by an Andrew Carnegie fellowship from the Carnegie Corporation of New York and by the New Hampshire Agricultural Experiment Station in support of Hatch Multi-State Regional Project W-4001 through joint funding of the National Institute of Food and Agriculture, U.S. Department of Agriculture, under award number 1013434, and the state of New Hampshire. The content is solely the responsibility of the author and does not necessarily represent the official views of the agencies supporting this research. Barbara Cook of the Carsey School of Public Policy provided geographic information system support.