download the brief
Key Findings

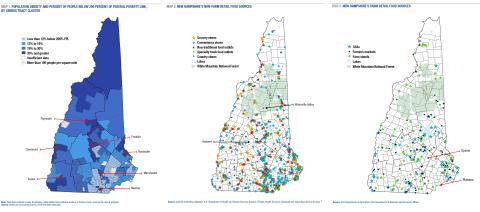
Much of northern and western New Hampshire has a higher proportion of low-income residents and low population density, factors that may be associated with increased risk of food insecurity.

The distribution of retail food sources across the state roughly mirrors the population distribution. However, residents outside the Interstate 93 corridor in northern New Hampshire have few food retailers to choose from, particularly grocery stores.

Food support sites—including school-based food programs and retailers that accept SNAP— generally mirror population distributions. However, community-organized food pantries more closely align with the distribution of low-income populations.
Even in a relatively well-off state like New Hampshire,1 food insecurity—the lack of consistent access to enough food for an active, healthy life2—affects about one in ten residents.3 However, there is no modern and comprehensive picture that explores the availability of food options across the state. This brief fills that gap with an assessment of New Hampshire’s food landscape, identifying geographic gaps in food access that can help practitioners and policymakers better serve Granite Staters.
Sparsely Populated Places Are More Often Low Income
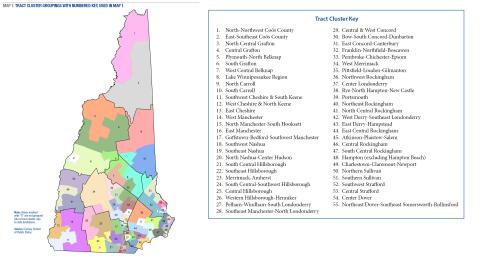
Map 1 shows the share of people below 200 percent of the federal poverty line—that is, below about $50,000 a year for a family of four—at the “tract cluster” level (see Box 1, the Data & Methodology section, and Map 7 for details on the tract clusters). The map indicates that the northern third of the state—roughly all of Coös and half of Grafton County—uniformly has the highest shares of low-income residents. In addition to these sites, low-income residents are clustered in the areas of Plymouth, Claremont, Franklin, Rochester, and parts of Manchester and Keene.
Two especially notable findings emerge from the map. First, north of Plymouth there are no Census tract clusters with fewer than 19 percent of people below twice the poverty line. Second, none of the state’s least-population-dense places have less than 12 percent of people with low incomes. However, some of New Hampshire’s most densely populated areas—Nashua and Manchester—stand out as having especially high shares of low-income residents, especially in contrast with higher-income suburbs. This pattern illustrates the consistently lower shares of low-income residents found in suburban places as opposed to urban and rural locales.4
In Swaths of the State, Residents Have No Grocery Stores Nearby
Map 2 shows the distribution of non-farm retail food sources throughout the state, with symbols indicating five different types of retail stores (see Box 2). There are several notable patterns. First, the distribution of retail sources roughly mirrors the population distribution, with many more retail options available in the southern half of the state than in the northern. Into the northern part of the state, the distribution of food sites generally follows Interstate 93, with few options beyond that corridor. As a result, those who live further from the highway have fewer easily accessible food sources. Second, the food retail landscape is heavily dominated by convenience stores and nontraditional food outlets, with only one-third as many grocery stores as convenience stores throughout the state. In much of Coös County, parts of West-Central Grafton County, and parts of Central Merrimack County, abutting towns have no grocery stores. Third, even in places with a grocery store one or two towns away—for instance, Waterville Valley or Andover—reaching that store may be difficult for residents who do not have access to private transportation, given that the public transportation infrastructure is often weak.
Uneven Distribution of Farm Food in a ‘Rural’ State
Map 3 shows the distribution of farm-related food sources throughout the state. These sites include intermittent farmers’ markets, seasonal or year-round farm stands, and farms that offer bundles of produce directly to customers during the growing season, called community supported agriculture, or CSAs.6
As with the distribution of non-farm sites, farm retailers are concentrated in the more populated regions of the state; in some of the state’s less-populated areas, several regions are bare of farm food options. In most of the White Mountain National Forest area, along with the area where Sullivan, Cheshire, and Hillsborough Counties intersect, options are limited. However, one area of the state is largely devoid of farm food options despite having substantial population density: a band of southeastern New Hampshire, from Epsom to Plaistow.
Box 1. Income, Geography, and Their Links to Food Insecurity
There are many risks for food insecurity, but perhaps the best-established is low income. Yet households do not need to be poor to experience food insecurity:7 research has shown that, even at twice the federal poverty line, food insecurity affects one in five households.8
The relationship between geography and access to sufficient, nutritious food is less clear. Some research finds that distance to the nearest supermarket is not associated with food security,9 while other studies show that food-insecure households are located further from large retailers and closer to convenience stores than their food-secure counterparts.10 There are at least some links between food access and food insecurity: food-insecure households report more difficulty in accessing food shopping and, in particular, find it harder to access affordable fruits and vegetables than households that are food secure.11 Finally, research shows that the rural retail food environment is consolidating, with many smaller outlets being replaced with fewer larger stores. As a result, rural residents shopping for food face higher transportation costs and may also encounter less variety or lower-quality fresh foods than do their suburban and urban peers.12
Taken together, the relationship between measures of food access and distance with food insecurity are complicated. In this brief, the share of residents with incomes below 200 percent of the poverty line and low population density serve as a proxy measures for risks for food insecurity. While these measures aren’t necessarily perfect predictors, they provide a starting point for identifying places where the distribution of food sources is mismatched with need.
Sites for Accessing Food Support Unevenly Distributed
The next three maps identify places where low- and moderate-income Granite Staters can access different kinds of food support. Map 4 shows retailers that accept the Supplemental Nutrition Assistance Program (SNAP, formerly known as food stamps) or the Special Nutrition Program for Women, Infants, and Children (WIC, a program for pregnant women and young children). Of course, the distribution of retailers that accept SNAP or WIC closely mirrors the pattern (although not the density) of retailers in Map 1. Again, in much of Grafton and Coös Counties, along with the area where Sullivan, Cheshire, and Hillsborough Counties intersect, SNAP and WIC sites are sparse. Additionally, around Boscawen and Deerfield and between Weare and New Ipswich, few sites accept WIC. In some cases, like in and around Deerfield, the sparse acceptance of SNAP and WIC may be partially reflective of the fact that smaller shares of residents there are low income. But it is important to note that even a small share of population that is low income can still translate to several thousand people who might need food support. It should also be noted that several of the SNAP-accepting sites include farm food sites, including farmers’ markets that allow shoppers to use electronic benefit transfer cards. This relatively new option can afford greater opportunities for low-income residents to access fresh and local foods.
Map 5 shows the distribution of food support sites for particular populations throughout the state. These indicate places where people—most often children—can access free or reduced-price foods through an institutional program.13 Most of these sites are schools offering the National School Lunch Program (and the School Breakfast Program, not shown separately). However, far fewer schools also offer additional programs like the Afterschool Snack Service and the Fresh Fruit and Vegetable Program, and Summer Food Service Program sites are relatively sparse throughout the state. In an interesting contrast, Coös County is home to a disproportionate share of the state’s Summer Food Service Program sites, dotted throughout the county, where need is high.
Map 6 shows the distribution of food pantries, a food support that is available to a broader population than those listed in Map 5. In contrast to the food supports linked to retailer locations (like SNAP and WIC, Map 4), and institutional settings (like schools, Map 5), food pantries tend to be initiated, organized, and staffed by community members, who have a good understanding of their own community’s needs. As a result, food pantries generally follow the distribution of low-income populations across the state: concentrations of pantries are found in Littleton, Berlin, Conway, Laconia, Concord, Rochester, Manchester, Nashua, and Raymond. While food pantries are important supports for low-income residents, days and hours of operation can be limited because pantries are often volunteer-staffed. This drawback can pose challenges for residents with no transportation or who work full-time or nonstandard hours.

Implications for Policy and Practice
For New Hampshire policymakers and practitioners working with low-income populations, the findings in this brief offer a useful reminder that Granite Staters with low incomes are not relegated just to urban Hillsborough County and Coös County. While the state’s most rural and urban places indeed have high rates of low-income residents, there are considerable pockets of low-income residents in all corners of the state, including in and around Claremont, Rochester, Franklin, and Keene. The income data used in this brief, provided at this sub-county level of geography, afford stakeholders a nuanced, reliable look at their communities in a way that can shape policy and practice dialogues moving forward.
That the retail landscape largely reflects the population distribution is not surprising, but identifying the type of retailers located across the state is informative. Although farms are not the only source for fresh foods, they can be an important one. That many communities in rural New Hampshire do not have access to farm-fresh foods is sobering, and identifying where residents have less-frequent access to fresh foods is useful for targeting nutrition information, planning new farm-to-table initiatives, and supplementing retail environments with additional food variety to meet community needs. Community-based food and nutrition organizations might consider whether additional infusions of fresh produce would be useful in areas devoid of farm foods.
Although grocery stores are often considered the gold standard for ensuring access to fresh foods, it is important to acknowledge the role that small corner stores and convenience stores play in supporting food access. Research in urban places has shown that these small stores increase community food security by providing a variety of affordable foods,14 and, in places where food access is otherwise limited, these retailers can be the difference between having food or not. Still, not all small stores and convenience stores offer variety, particularly in terms of fresh foods, and the processed and prepackaged foods they do sell may not align well with nutrition standards. Community health liaisons, local retailers, and other stakeholders may be able to assess where demand for fresh foods might spark efforts to improve small store offerings.
Understanding the distribution of low-income populations and of food access across the state is important, but these are not the only factors driving food insecurity and health. Some research suggests that living in a “food desert” shapes food access, but not diet quality,15 and that just increasing access to fresh fruits and vegetables doesn’t necessarily make people more likely to purchase and eat these items.16 However, research shows that even a brief intervention—for example, providing information about a healthy foods incentive program—can be effective. In one study, researchers gave SNAP-enrolled adults some information and a small incentive to participate in a SNAP-matching program called Double Up Food Bucks, to be spent at farmers’ markets. Adults who received the information and the $10 voucher were nearly four times as likely to participate in SNAP and also significantly increased their produce consumption.17 Evaluation of the implementation of Double Up Food Bucks in New Hampshire might provide insights about useful paths forward for improving nutrition.
Finally, it is important to note that this brief explores the accessibility of food but not the variation in its availability (e.g., quality and variety of food available in specific locations) nor in its affordability. Challenges of nutrition and health cannot be addressed through improving access alone; policymakers and practitioners should continue to consider ways to support low-income Granite Staters on all these axes amid this new understanding of the food landscape.
Data & Methodology
Data for this project were aggregated from a variety of sources. For identifying the share of people who are low income, I use data from the U.S. Census Bureau’s American Community Survey 2016 five-year estimates.18 These data were obtained at the tract-level and aggregated up into the “tract clusters” that appear in Map 1, to improve the reliability of the estimates. To identify tracts that should be grouped together into a given cluster, I first calculated the percent of people below 200 percent of the federal poverty level in each tract. I then classified each tract into a low-income quartile, based on the distribution of low-income rates across the state. Using detailed maps of the tracts provided by the U.S. Census Bureau, I grouped tracts into draft clusters based on two criteria. First, the tracts must be geographically contiguous, and, second, the tracts must have relatively similar low-income rates (defined as being in the same or neighboring low-income quintiles). As tracts were grouped into new clusters, I recalculated a cluster-level low-income rate to improve the precision of the resulting estimates. After considering both absolute and relative cutoffs for acceptable margins of error, and identifying no real disadvantage to either approach, I selected “+/- 5 percentage points” as my threshold for “reasonable.”19 While this results in a somewhat large range around a given estimate, using tract-level data in a small state means that balancing geographic detail with statistical precision is a challenge.
More than 4,000 food sites are included in Maps 2-6. Data were first obtained through a marketing database, which provided a starting point for the list. These data were then augmented by, and checked for accuracy against, food protection data held by the state, data from the USDA Food and Nutrition Service, and data from various New Hampshire-based websites (e.g., Made in New Hampshire). Sites that primarliy sell prepared food to be eaten on premise (i.e., fast food), that specialize in sweets or alcohol (e.g., maple sugar houses, cake shops) or only sell live animals are excluded here.
Box 2: Glossary of Food Sources
Retail food sites:
Grocery store—A retail site that primarily sells food, both perishable and nonperishable. Includes supermarkets and smaller grocery stores.20
Convenience store—A retail site that sells a limited range of household goods and groceries, with few, if any, perishable goods available. Includes stores attached to gas stations and “corner market” or “bodega” stores.
Nontraditional food outlet—A retail site that sells food, but not as its primary purpose. Includes pharmacies, dollar stores, and big-box stores like Wal-Mart.
Specialty food outlet—A retail site that sells a specific type of (usually fresh) food product(s). Includes, for example, bakeries, seafood markets, gourmet shops, and butchers, and excludes retailers that specialize in sweets or alcohol (e.g., cupcakes, maple syrup, or wine).
Country store—A retail site that sells a wide variety of goods, usually including nonperishable foods. Often also includes a delicatessen.
Farm retail food sites:
Community Support Agriculture (CSA) sites—A site that offers consumers the chance to pledge support to a farm in advance of the growing season in exchange for regular distributions of farm goods (usually in the form of a weekly box of produce). Usually seasonal.
Farmers’ markets—A market site at which farmers sell produce, meat, and value-added goods (e.g., cheese, pies) directly to consumers. Usually open for limited hours weekly; usually seasonal.
Farm stands—A retail site at which farm-fresh goods are sold directly to consumers, usually onsite at the farm. Often seasonal.
Retail food sites accepting SNAP and WIC:
SNAP site—Any retailer authorized to accept Supplemental Nutrition Assistance Program (SNAP) benefits (formerly known as food stamps) for the purchase of perishable or
nonperishable food items.
WIC site—Any retailer authorized to accept Special Supplemental Nutrition Program for Women, Infants, and Children (WIC) benefits for the purchase of perishable or nonperishable food items.
Food support sites for special populations:
National School Lunch Program—A federally assisted meal program operating in public and nonprofit private schools and residential child care institutions. It provides nutritionally balanced, low-cost or free lunches to children each school day
Child and Adult Care Food Program—CACFP provides aid to child and adult care institutions and family or group day care homes for the provision of nutritious foods that contribute to the wellness, healthy growth, and development of young children and the health and wellness of older adults and chronically impaired disabled persons.
Afterschool Snack Service—A component of the National School Lunch Program, it is a federally assisted snack service that fills the afternoon hunger gap for school children. It is administered at the federal level by U.S. Department of Agriculture (USDA) Food and Nutrition Service. At the state level, it is administered by state agencies and operated through agreements with local school food authorities, which are ultimately responsible for service’s administration.
Summer Food Service Program—The SFSP ensures that low-income children continue to receive nutritious meals when school is not in session.
Fresh Fruit and Vegetable Program—A federal program that provides “free fresh fruits and vegetables to children at eligible elementary schools during the day.”21
Food pantries:
Sites that distribute bags or boxes of groceries directly to those in need, usually limited to residents of the community in which the pantry is located.
Box 3: Change in Income and the Food Landscape Over Time
This brief updates an earlier Carsey brief exploring food sources across the state and risks for food insecurity. While there are significant differences22 in the methodological approach between papers, some conclusions can be drawn around changes across the Granite State since those data were collected in 2010–2011. First, while the overall levels of income and poverty may have changed, the spatial patterning of New Hampshire’s low-income families has not changed much, with pockets in the North Country, the western part of the state, and the largest cities (Manchester and Nashua), and dotted throughout the Central and Seacoast regions. Second, the areas of the state that are least populated have not changed at all, with most of the state outside Hillsborough, Rockingham, and Strafford Counties having fewer than 100 people per square mile. Finally, comparing the landscape of food sources across briefs is somewhat difficult, since this brief uses a more comprehensive data source for identifying retail sites and maps those sites in slightly different categories. What can be noted, however, is that there appears to be some loss of farm food outlets particularly in Central New Hampshire, and that in both periods all retail options are sparse in parts of Coös and Grafton Counties.
Endnotes
1. See Appendix Table 1 in Jessica A. Carson, Andrew Schaefer, and Marybeth J. Mattingly, “Data Snapshot: Declines in Child Poverty Continue in 2017: Overall Rate Still Above Pre-Recession Level” (Durham, NH: Carsey School of Public Policy, University of New Hampshire, 2018); Gloria Guzman, “Household Income: 2016,” American Community Survey Briefs, No. ACSBF/16-02 (Washington, DC: U.S. Census Bureau, 2017).
2. U.S. Department of Agriculture, Economic Research Service, “Food Security in the U.S.,” 2018, https://www.ers.usda.gov/topics/food-nutrition-assistance/food-security….
3. New Hampshire Fiscal Policy Institute, “Food Insecurity in New Hampshire Remains Higher Than Pre-Recession Levels,” Common Cents, New Hampshire Fiscal Policy Institute blog, 2017, http://nhfpi.org/commoncents/food-insecurity-in-new-hampshire-remains-h….
4. Carson, Schaefer, and Mattingly, 2018.
5. The state has fifteen cities and towns that provide their own food protection efforts: Bedford, Berlin, Claremont, Concord, Derry, Dover, Exeter, Keene, Manchester, Merrimack, Nashua, Plaistow, Portsmouth, Rochester, and Salem.
6. It is important to note that not all of these sites are necessarily accessible year-round. Many sites, especially those that sell only fresh produce and not also value-added products (e.g., jam, cheese) may be limited by the New England growing season. Importantly, although the data for Map 3 are from the best available known sources, they are derived from directories in which inclusion is voluntary. As a result, this map may not represent every farm food option throughout the state, and missingness of these data may not be random (that is, missing data may be disproportionately clustered in certain areas of the state).
7. Vanessa Wight, Neeraj Kaushal, Jane Waldfogel, and Irv Garfinkel, “Understanding the Link Between Poverty and Food Insecurity Among Children: Does the Definition of Poverty Matter?” Journal of Child Poverty 20, no. 1 (2014): 1–20.
8. Christine M. Olson, Kendra Anderson, Elizabeth Kiss, Frances C. Lawrence, and Sharon B. Seiling, “Factors Protecting Against and Contributing to Food Insecurity Among Rural Families,” Family Economics and Nutrition Review 16, no. 1 (2004): 12–20; Judi Bartfeld and Rachel Dunifon, “State-Level Predictors of Food Insecurity Among Households With Children,” Journal of Policy Analysis and Management 25, no. 4 (2006): 921–42; Craig Gundersen, Brent Kreider, and John Pepper, “The Economics of Food Insecurity in the United States,” Applied Economic Perspectives and Policy 33, no. 3 (2011): 281–303.
9. Xiaoguang Ma, Angele D. Liese, Bethany Bell, Lauren Martini, James Hibbert, Carrie Draper, and Sonya J. Jones, “Perceived and Geographic Food Access and Food Security Status Among Households With Children,” Public Health Nutrition 19, no. 15 (2016): 2781–88; Sharon I. Kirkpatrick and Valerie Tarasuk, “Assessing the Relevance of Neighborhood Characteristics to the Household Food Security of Low-Income Toronto Families,” Public Health Nutrition 13, no. 7 (2010): 1139–48.
10. Brian J. Thomas, “Food Deserts and the Sociology of Space: Distance to Food Retailers and Food Insecurity in an Urban American Neighborhood,” International Journal of Humanities and Social Sciences 4, no. 7 (2010): 1545–54.
11. Ma et al., 2016.
12. Joseph R. Sharkey, “Measuring Potential Access to Food Stores and Food-Service Places in Rural Areas in the U.S.,” American Journal of Preventive Medicine 36, no. 4 (2009): S151–55.
13. This is “most often children,” as many of these programs are administered in a school-based setting. However, the Child and Adult Care Food Program is also administered in adult day care sites, and the Summer Food Service Program is also sometimes available to parents of low-income children or other community members.
14. Anne Short, Julie Guthman, and Samuel Raskin, “Food Deserts, Oases, or Mirages? Small Markets and Community Food Security in the San Francisco Bay Area,” Journal of Planning Education and Research 26 (2007): 352–64.
15. Jason P. Block and S.V. Subramanian, “Moving Beyond ‘Food Deserts’: Reorienting United States Policies to Reduce Disparities in Diet Quality,” PLoS Med 12, no. 12 (2015): e1001914.
16. Mienah Z. Sharif, Stephanie L. Albert, Alec M. Chan-Golston, Gilberto Lopez, Alice A. Kuo, Michael L. Prelip, Alexander N. Ortega, and Deborah C. Glik, “Community Residents’ Belief About Neighborhood Corner Stores in 2 Latino Communities: Implications for Interventions to Improve the Food Environment,” Journal of Hunger and Environmental Nutrition 12, no. 3 (2017): 342–51.
17. Alicia J. Cohen, Caroline R. Richardson, Michele Heisler, Ananda Sen, Ellen C. Murphy, Oran B. Hesterman, Matthew M. Davis, and Suzanna M. Zick, “Increasing the Use of a Healthy Food Incentive: A Waiting Room Intervention Among Low-Income Patients,” American Journal of Preventive Medicine 52, no. 2 (2017): 154–62.
18. While data on income do exist at the tract and town levels, the associated margin of error with these estimates is substantial, and casts serious doubt onto their reliability. Yet county-level data are not granular enough to fully assess within-state patterns. As an alternative, I use county tract data and aggregate up. For more detail on this process, see the Data & Methodology section.
19. Note that one tract cluster has a margin of error that is slightly above 5 percentage points (5.1), but given the alternative of subsuming this cluster into another, or leaving the data missing, I chose to use “rounds to 5 percentage points” as the criteria for “reasonable” in this case. The specific cluster is number 52, Southwest Strafford.
20. Distinguishing grocery stores from convenience stores is not always straightforward. In cases where a business’s name is not clear, I classify businesses as grocery stores if they sell fresh produce and meat. Small markets targeting clientele of specific ethnicities (e.g., Latinx or Russian) and corner bodegas are classified as grocery stores in cases where the store appears to offer fresh foods alongside packaged and dry goods.
21. USDA Fresh Fruit and Vegetable Program.
22. Several methodological differences exist between these briefs. First, the prior brief identifies the distribution of low-income populations by using town-level poverty data from the Census Bureau, which, given very small sample sizes, have significant margins of error attached. This brief instead relies upon estimates of families at twice the poverty line and aggregates tract-level data up to tract clusters to improve the reliability of those estimates. Second, where the original brief relied on a marketing database to identify retailers, this brief supplements those data with information from the state of New Hampshire that verifies the location of licensed food providers. In adding state data, it became clear that the marketing data were considerably incomplete. This brief also distinguishes between country stores and grocery stores, based on the differences in foods those types of shops provide, distinguishes between different kinds of farm food retailers, and maps the location of “public” food sources differently. For the original brief see Barbara Wauchope and Sally Ward, “Mapping Food Insecurity and Food Sources in New Hampshire Cities and Towns” (Durham, NH: Carsey Institute, University of New Hampshire, 2012), https://scholars.unh.edu/carsey/163/.
About the Author
Jess Carson is a research assistant professor with the Vulnerable Families Research Program at the Carsey School of Public Policy. Since joining Carsey in 2010, she has studied poverty, work, and the social safety net, including policies and programs that support low-income workers like affordable health insurance, food assistance programs, and quality child care.
Acknowledgments
The author thanks her Carsey School of Public Policy colleagues, including Michael Ettlinger, Curt Grimm, and Michele Dillon, for their comments on earlier drafts; Laurel Lloyd for her assistance with layout; Sarah Leonard for research assistance; and Barb Cook for mapmaking expertise. Beth Mattingly also provided comments on an earlier draft in her capacity as the director of research on vulnerable families, prior to her departure from the university. Finally, thanks to Patrick Watson for valuable editorial assistance.
Additional thanks to the New Hampshire Division of Public Health Services Food Protection and the public health officials at the state’s fifteen self-inspecting cities and towns for their kind provision of data on retail food sites.
Funding for this brief was provided by the New Hampshire Children’s Health Foundation.