Key Findings
The COVID-19 pandemic has spawned devastation across the United States. All segments of the population have been impacted, but people of color have borne the brunt of infections from the coronavirus and deaths from COVID-19. Nationally Latinos and Blacks are contracting the virus at rates three times higher than Whites,1 and Blacks are dying at a rate 3.6 times and Latinos 2.5 times higher than Whites.2 Furthermore, Blacks and Latinos have sustained major setbacks to their economic sustainability.
The pandemic led to the loss of approximately 25 million jobs between February and April and a recovery of about 9 million jobs between then and June.3 These losses represent a historically unprecedented level of unemployment and while as of June some areas have exhibited a slow recovery, the near-term prospects for those who have lost jobs is uncertain at best. While the pandemic has affected everyone’s work life, it has done so unequally. Indeed, the rising job loss has been particularly dire for Blacks and Latinos who have experienced exceptionally high levels of unemployment and slow rates of job recovery.4
While the overall national portrait of the impact of the virus on the economy and job situation is becoming increasingly clear, much less is known for different populations within the country. Job loss and recovery have been much more challenging for certain racial/ethnic, gender, and nativity groups. Policymakers and community leaders need information to monitor and act on the variations that exist in order to ensure that certain segments of the population are not left behind in the economic recovery from the pandemic. At the end of July 2020 tens of millions of workers who had lost their jobs also lost the additional $600 unemployment payment from the CARES Act. Moreover, undocumented immigrants—including their citizen spouses—were ineligible to receive the maximum $1,200 stimulus check that many Americans received.5 Disturbingly, as hotspots of infections and deaths began to crop up in June, beginning in mid-July there was an uptick of 1.4 million persons filing for unemployment for the first time, reversing a 15-week decline.6
This research is one of the first efforts to provide a broad and comprehensive overview of the inequities in job loss and recovery over the last several months of the pandemic. Our analysis highlights the wide variations in unemployment and the level of job loss over the last several months that have taken place to date across the nation’s demographic groups that have historically suffered disparities in the workforce, including persons of color, women, and immigrants. It is particularly unfortunate that the calamity of the pandemic comes on the heels of major improvements in job prospects that these groups made over the last decade, as the workforce emerged from the Great Recession.
The U.S. unemployment rate nearly tripled between February and April 2020, from 3.9 percent to 14.6 percent. During this period, employment plummeted by approximately 24.7 million jobs, with about one of every six jobs in February lost by April. Since April, the country’s unemployment level has inched downward, falling to 13.0 percent in May and to 11.2 percent in June. Between April and June, there was a growth of 9.1 million jobs, an increase of 7.5 percent.
While job loss has been universal, it has been particularly devastating to people of color. Figure 1 illustrates the monthly rates of unemployment among the largest race/ethnic groups between February and June 2020. The level of unemployment started to rise in March and peaked in April, across the board. In April, Latinos had the highest unemployment rate at nearly 19 percent, followed by Blacks at 16.4 percent. Whites had the lowest unemployment level at approximately 13 percent. The White jobless rate continued a downward slide subsequently to a low of 9.2 percent in June. Rates for Blacks and Latinos declined by June as well (14.9 percent and 14.6 percent, respectively), but even then the unemployment rates of Blacks and Latinos were still higher than the White jobless level at its peak in April.
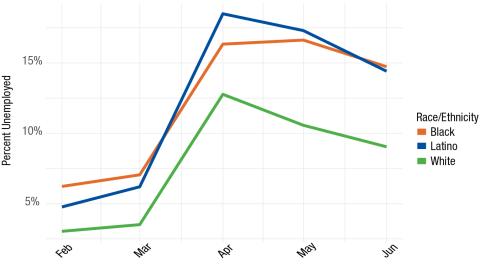
Source: IPUMS CPS Monthly Data. Calculations by Corey S. Sparks, PhD.
Of course, the demographic and socioeconomic profile of the workforce of Whites, Blacks, and Latinos varies, and that could account for the unemployment differences along racial and ethnic lines. For example, Latinos are a relatively young workforce, with 42 percent being less than 35 years of age compared to 32 percent of Whites. In addition, Latino (22.8 percent) and Black (30.6 percent) workers are less likely to have a bachelor’s degree or higher compared to Whites (44.7 percent). And Latino and Black workers also are more likely to be disproportionately represented in jobs that have been especially hard hit by the pandemic. Approximately 22 percent of Blacks and Latinos work in the service sector, compared to 14 percent of Whites.
Still, accounting for these factors, we find that racial disparities in unemployment persist. Figure 2 shows the unemployment levels in June across age groups. Clearly, younger workers tend to have the highest levels of joblessness, but within all age groups Whites have much lower unemployment rates compared to Blacks and Latinos. In most cases, the unemployment rates of workers of color are at least 50 percent higher than those of Whites. For example, Blacks and Latinos 45–54 years of age have unemployment levels about twice as high as those of their respective White counterparts.
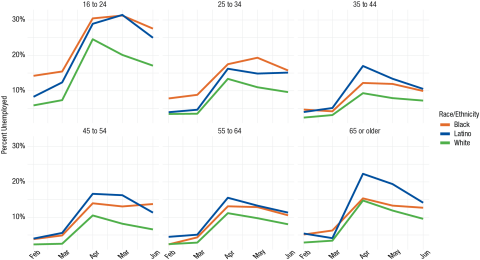
Source: IPUMS CPS Monthly Data. Note: Calculations by Corey S. Sparks, PhD.
Education is negatively associated with unemployment (Figure 3), but across all but one educational category Whites have the lowest unemployment rates. The one exception is among males who are not high school graduates, where Latinos have the lowest unemployment rate (16.4 percent versus 18 percent among Whites). Workers of color with an associate’s degree as well as Latinos with a bachelor’s degree or higher have jobless rates about 50 percent higher than those of Whites. Latinos with a bachelor’s degree (unemployment rate of 10.8 percent) are more likely to be without a job than are Whites with an associate’s degree (8.7 percent). We also see that women, regardless of education level, mostly had higher unemployment than men during this period.
Figure 3. Unemployment Rates by Education Level, Gender, and Race/Ethnicity from February to June 2020
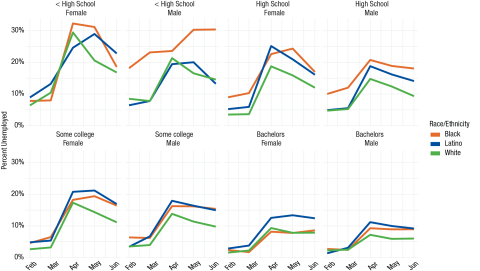
Source: IPUMS CPS Monthly Data. Calculations by Corey S. Sparks, PhD.
Men overall have fared much better than women in employment. For example, while women (3.5 percent) actually had a lower rate of unemployment than men (4.2 percent) in February, by April this trend had reversed, with the unemployment rate of women (15.8 percent) surpassing that of men (13.4 percent). The male advantage has held into June. While as a whole men fared better than women, Latino and Black men faced much higher rates of unemployment compared to White men.
The disadvantages of women are particularly acute among women of color (Figure 4). Latina women have the highest jobless rates throughout the pandemic, peaking at 20.8 percent in April, and they continued to have the highest rate of unemployment, at 16.3 percent, in June, followed by Black women (14.2 percent). In contrast, White women had the lowest jobless rate throughout the period, with a rate of 10.1 percent in June.
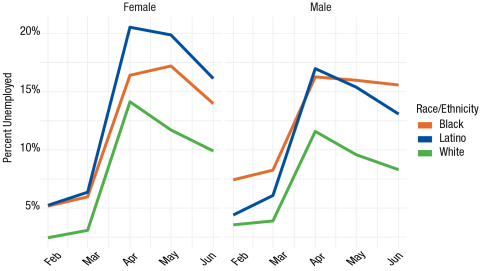
Source: IPUMS CPS Monthly Data. Calculations by Corey S. Sparks, PhD.
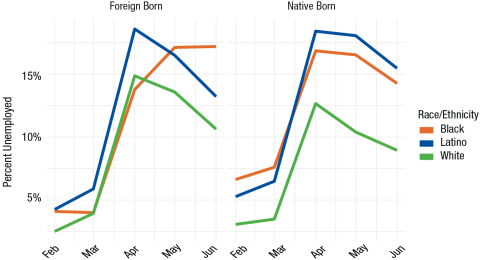
There are also variations in unemployment by place of birth among Latinos, the group with the largest immigrant population. Foreign-born Latinos had a lower unemployment rate than their native-born counterparts before the pandemic, but at the peak of unemployment in May the two groups were equal, and the immigrant advantage continued between April and June (Figure 5). In June, Latino immigrant men had a jobless rate of 11.4 percent compared to 14.9 percent for U.S.-born Latinos (data not shown here). The immigrant employment advantages since April may reflect a higher percentage of immigrants being in front-line jobs and in essential industries, with the differences narrowing in June as wider segments of industries opened for business. In contrast, among Latina women, the foreign-born have fared slightly less favorably compared to women born in the United States. Latina immigrant women had
Source: IPUMS CPS Monthly Data. Calculations by Corey S. Sparks, PhD.
unemployment rates upwards of 21 percent in April and May (data not shown), while native-born Latina women had rates of 19.9 percent. Nonetheless, in June, both groups of Latina women had similar jobless levels (foreign born, 16.4 percent; native born, 16.2 percent). Among Blacks and Whites, foreign-born individuals had higher unemployment rates than those born in the United States.
As noted earlier, the United States lost approximately 25 million jobs between February, the peak of employment this year, and April, the low point. Between April and June, about 9 million jobs have been regained. In this portion of the analysis, we compare the number of workers in June to that in February, an indicator that we refer to as the “net job loss rate.”
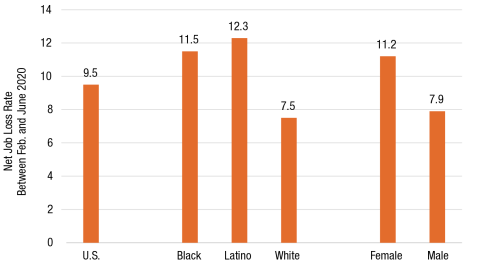
Overall in the United States, the net job loss rate refers to the percent of jobs that have been lost between February (when employment peaked before the pandemic) and June. It stands at 9.5 percent (see Box 1), signifying that the nation’s jobs have declined by nearly 10 percent between February and June (Figure 6).
Source: IPUMS CPS data. Analysis by Rogelio Sáenz, PhD.
The job loss situation is most likely worse than at first glance. In a typical year there tend to be more workers in June and the other summer months as many teenagers work while they are off from school and seasonal farm workers are brought in to work in agriculture.* It is worthwhile, then, to compare the net job loss rate in February–June 2020 to the respective net job loss rates of the previous two years. While during the pandemic there were 9.5 percent fewer jobs in June than in February 2020, the past two years have actually seen more workers in June than in February (1.4 percent more in 2018 and 0.8 percent more in 2019). Thus, without the pandemic, it is likely that this year the nation would have had employment growth between February and June.
* Lauren Fay Carlson, “Breaking Down the Unique Challenges of Michigan’s Migrant Farmworkers During COVID-19,” Rapid Growth, June 22, 2020, https://www.rapidgrowthmedia.com/features/migrant_farmworkers_COVID19.aspx.
As we observed with unemployment, job loss varies substantially across racial and ethnic groups. Whites have the lowest level of job loss with 7.5 percent fewer workers in June than in February 2020 (a loss of approximately one of every 13 jobs in February). In contrast, the job loss of Latinos (12.3 percent) and Blacks (11.5 percent) is more than 50 percent above that of Whites. Latinos have lost about one of eight jobs that they held in February and Blacks one of nine.
Moreover, consistent with gender differences in unemployment, men have sustained less job loss than women. Men had approximately 8 percent fewer jobs in June than in February, while women had slightly more than 11 percent fewer.
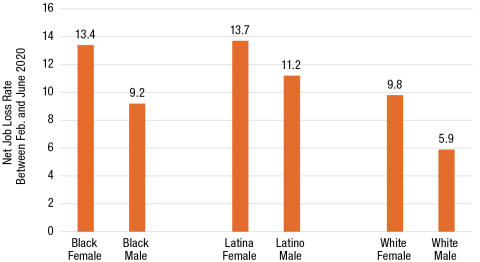
Men have fared better than women across racial/ethnic groups too, with lower levels of job loss between February and June. Yet, across genders, Whites hold an advantage over other groups with the lowest levels of employment loss (5.9 percent among White men and 9.8 percent among White women) (Figure 7). Latina (13.7 percent) and Black (13.4 percent) women have fared the worst, with net job loss rates translating to these women losing roughly one of every seven jobs that they held in February. Black men stand out. We saw above that Black men had higher unemployment rates in June than Black and White women and Latino and White men. Their net job loss rate, however, is lower than for Black, White, and Latina women and Latino men—though still substantially higher than for White men. These contradictory trends are due to the size of the civilian labor force (employed and unemployed persons) of Black men shrinking very little between February and June (declining by 0.5 percent) compared to other groups (White men, -1.0 percent; Latino men, -2.1 percent; White women, -2.2 percent; Latina women, -2.4 percent, and Black women, -4.6 percent).
Source: IPUMS CPS data. Analysis by Rogelio Sáenz, PhD.
In this policy brief, we have highlighted several aspects of the COVID-19 pandemic’s effects on unemployment patterns that have not been explored elsewhere, notably the variation by race/ethnicity, gender, nativity, and socioeconomic status. Job loss between February and June has been an unequal process, and the picture we have described is one of systemic inequality in both the initial effects of the pandemic on the country’s workforce as well as the continued effects through June.
The COVID-19 pandemic is placing major challenges on the U.S. workforce. In particular, Black and Latino workers, despite suffering from major upticks in unemployment, have been disproportionately overrepresented among workers who cannot work from home, placing them at elevated risk of contracting the coronavirus.7 Furthermore, these in-person workers (although also true of those working from home) require assistance with the care of children and other dependents. People who have lost their jobs or who have been furloughed face grim prospects of finding employment and losing health insurance during these highly precarious times. Undocumented immigrants, many of whom have been on the front lines providing basic services and food supplies to the American public, have been completely left out of stimulus funds, as have their U.S.-citizen spouses.
The benefits associated with the CARES Act of March 2020 expired in July, leaving tens of millions of unemployed people in dire straits. Implications of the inequality in both joblessness and job recovery will likely have far-reaching effects for other aspects of life. Some obvious implications of prolonged joblessness related to COVID-19 are potential spikes in defaults on mortgages and rent payments, especially as rent assistance programs phase out of operation. Other implications of joblessness are food insecurity among households. Without reliable employment and with uneven job recovery, at-risk populations will face exacerbated risks of temporary and longer-term food insecurity. These potential housing instability and food insecurity contexts have the potential to impact health and well-being among already marginalized populations. Further study of the local-area impacts of these economic conditions is needed, as notable state-level differences in the patterns discussed herein are also present. Unfortunately, the premature opening of business in many states in the South and West has resulted in major outbreaks in those regions, particularly in Arizona, Texas, and Florida.
As people of color continue to bear the brunt of the ravage of the pandemic, it exposes profound racial divides in this country that policymakers will need to address with an equity lens.
Monthly Current Population Survey microdata are from the Integrated Public Microdata Series, IPUMS –CPS. Data are subset to contain only those respondents in the civilian labor force over age 16. All estimates are weighted by the WTFINL variable to be representative of the U.S. labor force. No statistical testing was done; all estimates presented are population-weighted means, so inter-group comparisons may not have statistical significance. A minimum sample size of 30 respondents for each population subgroup, per month, was used to avoid statistically unstable estimates. The ethnicity variable created here is a combination of both the self-reported race and Hispanic ethnicity of the respondent. Latino/a ethnicity includes all respondents who reported Hispanic ethnicity, regardless of race, Whites include non-Hispanic White respondents and Blacks include non-Hispanic Black respondents. All data and code related to this brief are available at Dr. Corey Sparks’s Github repository https://github.com/coreysparks/unemployment.
1. Ricard A. Oppel Jr., Robert Gebeloff, K.K. Rebecca Lai, Will Wright, and Mitch Smith, “The Fullest Look Yet at the Racial Inequity of Coronavirus,” New York Times, July 5, 2020, https://www.nytimes.com/interactive/2020/07/05/us/coronavirus-latinos-african-americans-cdc-data.html.
2. Tiffany Ford, Sarah Reber, and Richard Reeves, “Race Gaps in COVID-19 Are Even Bigger Than They Appear,” Brookings, June 16, 2020, https://www.brookings.edu/blog/up-front/2020/06/16/race-gaps-in-covid-19-deaths-are-even-bigger-than-they-appear/.
3. Bureau of Labor Statistics, “Employment Status of the Civilian Noninstitutional Population 16 Years and Over, 1985 to Date” (Washington, DC: Bureau of Labor Statistics, 2020), https://www.bls.gov/web/empsit/cpseea01.pdf.
4. Danielle Kurtzleben, “Job Losses Higher Among People of Color During Coronavirus Pandemic,” NPR, April 22, 2020, https://www.npr.org/2020/04/22/840276956/minorities-often-work-these-jobs-they-were-among-first-to-go-in-coronavirus-layo.
5. Jenny Jarvie, “These U.S. Citizens Won’t Get Coronavirus Stimulus Check—Because Their Spouses Are Immigrants,” Los Angeles Times, April 20, 2020, https://www.latimes.com/world-nation/story/2020-04-20/u-s-citizens-coronavirus-stimulus-checks-spouses-immigrants.
6. Charisse Jones, “’The Jobs Just Aren’t There’: Number of Americans Filing for Unemployment Rises for First Time Since March, Even as Aid Is Set to Shrink,” USA Today, July 23, 2020, https://www.usatoday.com/story/money/2020/07/23/unemployment-claims-1-4-m-seek-jobless-benefits-covid-19-surges/5481957002/.
7. Carlos Ballesteros, “Working From Home Not an Option for Most Black and Latino Workers During Coronavirus Crisis,” Chicago Sun Times, April 9, 2020, https://chicago.suntimes.com/coronavirus/2020/4/9/21212043/coronavirus-covid-19-racial-disparity-black-latino-workers-work-from-home.
The authors appreciate the suggestions and comments of Jess Carson and Michael Ettlinger of the Carsey School of Public Policy on an earlier draft of this policy brief. The authors also thank Laurel Lloyd of the Carsey School in the preparation of the brief for publication.
About the Authors

Rogelio Sáenz is a professor in the Department of Demography at the University of Texas and a policy fellow at the Carsey School of Public Policy. He has written extensively on issues related to demography, Latinos, race, inequality, and public policy.

Corey Sparks is an associate professor in the Department of Demography at the University of Texas at San Antonio. He has written extensively on statistical methodology, spatial analysis, and health inequality in the United States and internationally.