download the brief
Key Findings


If all middle-class working families with young children were to pay what typical upper-middle and middle-class families pay for child care, roughly $6,900 per year on average, an additional 21 percent would be pushed below the middle-class threshold.
Most Americans believe that through hard work and saving they can secure an economically sound, middle-class lifestyle.1 But for many working families, the high price of child care makes this goal extremely challenging.
In this brief, we present estimates of the number of families that cannot maintain a middle-class income as a result of child care expenses. We find that, indeed, many working families cannot attain middle-income status because of child care expenses, while many additional families maintain this status by relying on unpaid child care, informal arrangements with family or friends, or below-market-rate services, potentially from unlicensed care providers. An even greater share of middle-class families would be pushed out if they incurred typical child care costs.
If we want to make a middle-class quality of life attainable for working families with young children, then public policies—including expanded public funding for child care, income maintenance programs, and refundable tax credits—could play an important role in supporting families with their child care needs.
Family Income and the Impact of Child Care Expenses
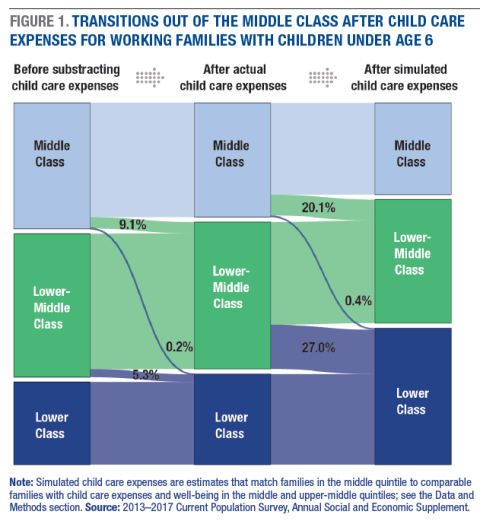
To illustrate the impact of child care expenses on middle-class families, we consider a family’s total economic resources before and after accounting for out-of-pocket child care expenses. Our approach to making these comparisons is, first, to estimate the number of families that are in the middle class without taking away child care expenses. Then, we estimate the number that are pushed below the middle-class threshold by actual child care expenses. Lastly, we estimate the number who would be pushed out of the middle class after simulating expenses for families paying nothing (and using informal care) and for families paying less than families of comparable size and with similar employment patterns. The findings do not describe the quality of child care arrangements or alternative options, but the simulated estimates illustrate the extent to which typical child care costs affect measures of economic well-being for families that are paying below market rates or relying on unpaid care.
As noted above, many working families with young children in the middle class and below (generally, families with less than $90,000 in annual income) do not pay any out-of-pocket child care expenses, or they rely on free or low-cost care from friends and family. These families may face implicit costs of care (exchanging services or foregoing work opportunities), and they may also be paying for lower-quality care than they might purchase if cost were not an issue. In order to estimate the full cost of child care, we use a statistical matching technique for comparable families (see Data and Methods). In this simulation, if all middle-class working families with children under age 6 paid the same child care expenses as similar families who are at least as well off (middle and upper-middle class) and paying for child care, then child care expenses would push an additional 20.5percent of families out of the middle class (specifically, about 20.1 percent from middle class to lower middle, and another 0.4 percent from middle class to lower class). For families with children under age 3, paying child care expenses similar to their peers would push an additional 21.2 percent of them below the middle class threshold. Because lower-middle-class families are less likely to pay out of pocket for child care, more families would be affected by accounting for simulated expenses: 27.6 percent would fall into a lower-class status. Note that this simulation exercise highlights the implicit costs of child care given parents’ work hours and family structure. However, if quality child care were more affordable and accessible, some parents might prefer to work more hours while others might prefer to coordinate work schedules in order to avoid formal child care.
In total, more than 1 in 4 middle-class working families with young children are pushed out of the middle class by actual or simulated child care expenses.
Addressing the Child Care Cost Burden
Financial support for working families with young children is a meaningful way to improve family well-being and could also improve the lives of those in poorer and working-class families. Such support could be delivered through the tax system via expanded tax credits geared toward child care expenses, through increased child care subsidies, or through a child allowance that provides direct assistance to families with children. On average, families pushed below the middle-class threshold are paying about $3,100 for child care (again, these averages include families who may not pay any out-of-pocket child care expenses or those paying less than market rate), while families pushed out by simulated expenses based on comparable peers would be paying about $9,000. For families with children under age 3, average child care expenses paid are about $2,900, and simulated expenses are $9,100. These are substantial expenditures and helping to cover them entirely would of course be costly.
The total spending gap between actual child care spending and simulated child care costs for families in the middle class or below is $234 billion a year. In other words, our current funding infrastructure for helping parents find and pay for affordable, quality child care is woefully inadequate. One way to support working families would be to increase funding for the Child Care and Development Fund (CCDF), which is currently targeted toward families below the middle class. The total federal funding for CCDF in fiscal year 2018 is approximately $8.1 billion, which is less than 4 percent of the spending gap for families in the middle class or below. Furthermore, the federal tax code could provide more generous support to help meet this gap through programs such as the Child Tax Credit and the Dependent and Child Care Tax Credit. The 2017 tax amendments expanded the maximum refundable portion of the Additional Child Tax Credit from $1,000 to $1,400, but bigger gains were targeted to higher-income families through the larger increase, from $1,000 to $2,000, in the nonrefundable Child Tax Credit.
A large body of evidence indicates that early interventions in childhood yield substantial long-term social and economic benefits. Helping families obtain adequate, affordable, and high-quality child care by closing the child care spending gap could help families have a more economically secure lifestyle and provide a positive environment for their children.
Data and Methods
Estimates in this brief are based on 2013–2017 data from the Current Population Survey’s Annual Social and Economic Supplement (CPS-ASEC), which corresponds to income and expenses during years 2012–2016. Based on Supplemental Poverty Measure (SPM) definitions, we construct a measure of family well-being as the income-to-needs ratio defined by a family’s total resources (or, disposable income) divided by the family-specific needs threshold for determining SPM poverty status. For the entire population of SPM-defined family units, we first estimate the distribution of families by income to needs where child care expenses are backed out of total resources. That is, we construct versions of SPM total resources with and without child care expenses subtracted from disposable income in order to identify the role of child care expenses on family well-being. Our target sample consists of working families (in which the parent(s) worked at all last year) with children under age 6 or under age 3.
Across all families (regardless of marital status or presence of children), we estimate the cutoff points for each quintile of family economic resources in order to define fixed values of income to needs for each 20-percent segment of the population.4 By this definition, a family would be in the middle 20 percent of the population if it had an income-to-needs ratio above 178.3 percent of the SPM needs threshold and below 266.9 percent. The bottom quintile includes families below 111.2 percent of the SPM needs threshold. To put these cutoffs in context, a working family with 2 adults and 2 children living in Kentucky could have a maximum income of $125,000 and be considered middle class, while the same family in New York might have a maximum income of $156,000 and similarly be in the middle 20 percent of income-to-needs. On the lower end of income, a family with 1 adult and 1 child would be in the middle 20 percent in either state with a minimum income of about $31,000.
Given these fixed estimates of the middle 20 percent, we then estimate how many families would be pushed out of the middle class when we subtract child care expenses from disposable income. Consider a 2-parent, 2-child working family with an income of $40,000 and an income-to-needs ratio of 180 percent. If this family spends $10,000 on child care, its income-to-needs ratio would fall to about 135 percent, which means it would be pushed below the middle-class threshold. Then, if we assume that this family spent an amount on child care comparable to a similar family in the middle or upper-middle quintile, say $15,000 total for both children, its income-to-needs ratio would fall to 109 percent, pushing it into the bottom quintile of family well-being.
Our simulated child care expenses are estimated by matching families in the middle quintile to comparable families with child care expenses and well-being in the middle and upper-middle quintiles. Including upper-middle-class families increases the sample size for statistical matching on peers who are as well off while excluding potential extremes for child care expenses in the top 20 percent of families. The matching algorithm uses a randomized procedure based on characteristics such as number of children under age 6, presence of any children under age 3, marital and work status,5 presence of teenagers or other adults, metropolitan status, region, and year. Also, our estimates are qualitatively consistent if we widen the measure of “middle.” If we included a larger number of families by defining middle class as the middle 30 percent or middle 40 percent, then the percent who are pushed out of the middle class decreases because the base number of families is larger; however, the number of families dropping out of the middle class is larger. For example, for families with children under age 6, the total number of families pushed out of the middle class by simulated expenses rises from about 1.1 million for the middle 20 percent, to 1.2 million for the middle 30 percent, and to 1.4 million for the middle 40 percent, while the percentages fall from 28 to 21 to 18, respectively. For families with children under age 3, simulated expenses push about 600,000 families out of the middle 20 percent, 700,000 out of the middle 30 percent, and 800,000 out of the middle 40 percent, while percentages fall from 28 to 21 to 18 percent, respectively.
Box 1: Definitions
We define middle class as the middle 20 percent of all families in the income-to-needs distribution. This definition involves ranking families into five groups so that, for the middle class, two-fifths of all families are ranked below (lower and lower-middle class) and two-fifths above (upper-middle and upper class).
For the income-to-needs ratio, we use a measure of a family’s disposable income consistent with the Supplemental Poverty Measure (SPM). Income includes ordinary income, safety-net benefits, and refundable tax credits received, less taxes paid and out-of-pocket medical, child care, and work expenses. Needs are measured as consumer spending estimates for food, clothing, shelter, and utilities, costs that vary geographically and by family size. We use the income-to-needs ratio instead of total income (or resources) in order to provide a more complete picture of family economic well-being.
Working families are defined as two-parent families in which both parents work or single-parent families in which the parent works.
Endnotes
1. Although “middle class” is difficult to define in purely economic terms, it remains a cultural ideal for American families. For public opinion survey responses, see “Fewer, Poorer, Gloomier: The Lost Decade of the Middle Class” (Washington, DC: Pew Social and Demographic Trends, 2012), http://assets.pewresearch.org/wp-content/uploads/sites/3/2012/08/pew-soc..., and Anna Brown, “What Americans Say It Takes to Be Middle Class” (Washington, DC: Pew Research Center, 2016), http://www.pewresearch.org/fact-tank/2016/02/04/what-americans-say-it-ta....
2. Families are defined throughout using the Supplemental Poverty Measure (SPM) family unit as constructed in the Current Population Survey, Annual Social and Economic Supplement. “Families with young children” refers to SPM family units with any child (own children or otherwise) under a given age. The total distribution of families across the population may include SPM units consisting of childless families as well as single adults.
3. The average child care expense for all working families who have young children and pay for care is about $6,800, and the average simulated expense based on middle- and upper-middle-class families is about $5,600. As a comparison, Grover J. Whitehurst (Evidence Speaks Reports 2, no. 48, Washington, DC: Brookings Institution, 2018), using data from the 2016 Early Childhood Program Participation Survey, shows that the median yearly cost of child care is $8,320 for families paying for center-based care at least eight hours per week without subsidy.
4. The results are generally consistent for broader definitions of the middle class. As we extend the definition from the middle 20 percent to the middle 40 percent, the total number of families pushed below the middle-class threshold increases, yet the percentage of those pushed downward gradually decreases.
5. Marital and work status are defined by the combinations of head and/or spouse/cohabitant working full time/full year; part time or part year; or no work at all last year.
Acknowledgements
The authors thank Michele Dillon, Michael Ettlinger, Curt Grimm, and Amy Sterndale of the Carsey School of Public Policy for comments on an earlier draft; Patrick Watson for his editorial assistance; and Laurel Lloyd and Bianca Nicolosi at the Carsey School for their layout assistance.
This research was made possible in part by a gift from Jay Robert Pritzker and Mary Kathryn Pritzker.