Key Findings
Every state that has an income tax offers some kind of tax break to those over 65 years of age. These breaks include 1) an extra exemption or deduction for those over age 65, and 2) favorable tax treatment of Social Security benefits and other ‘retirement’ income. Substantial in size, these tax breaks can result in elderly taxpayers paying up to one-third less than their non-elderly counterparts.1
Despite the size and scope of these existing tax breaks, every spring brings a raft of policy proposals to state legislatures to expand those tax breaks even further. For example, in 2022, at least 20 states considered and, in at least 8 cases, passed laws expanding these tax breaks. Because states already have tax provisions that lead many lower- and middle-income seniors to pay little in income taxes, these proposed expansions benefit primarily higher-income seniors. Why, then, are these proposals a perennial part of the state fiscal landscape? According to policy advocates and the policymakers themselves:
“We want every senior to benefit from this because it helps our seniors not only remain independent, which is what we want them to do in our community, but it’s also going to pump more money into our economy, which is what we need them to do,” says Cabinet Secretary for Aging and Long-Term Services, Katrina Hotrum-Lopez (in New Mexico, which eliminated all taxes on Social Security benefits in 2022).2
Another example comes from Iowa in which a new law exempts all ‘retirement income’—defined as “a pension, an annuity, a self-employed retirement plan, deferred compensation, IRA distribution, or other retirement plan benefits” from Iowa taxation.3 Chris Hagenow, vice president of Iowans for Tax Relief and a former Republican state representative, told Des Moines TV station KCCI in 2022 that the move will help Iowa hold on to more of its citizens: “These folks have contributed to their communities, their families, [and] their churches all along and then, because of our tax code, there’s an incentive for them to leave Iowa once they reach their retirement age.”4
Among the most elaborate economic growth-focused explanations comes from South Carolina 2018 gubernatorial candidate, Yancy McGill, who proposed eliminating all income taxes on seniors:
“The economic growth from all the new seniors migrating here will swell the coffers of state and local government, in the form of additional sales tax, gas tax, and other incremental revenue sources…Many of these out of state seniors have significant wealth that they bring with them, swelling South Carolina investment businesses, such as banks, financial institutions, etc…This new “industry,” senior citizens, would diversify our economy and reduce our reliance on more cyclical sectors of our economy…Many of these new citizens are retired in name only and would become a significant source of new talent for our philanthropic and charitable organizations.”5
These quotes are just a sampling of the arguments made each year in favor of expanding income tax breaks for senior citizens. While fairness is also sometimes an appeal, a universal thread is that such tax breaks will be ‘good’ for the state. As the above quotes suggest, these tax breaks are promoted as a way of keeping the elderly from leaving the state or attracting ‘new seniors’, which will ‘pump more money into the economy.’
This brief draws on our recently published study that investigates, directly, the impact on state economic growth of expanding income tax breaks for seniors.6 It summarizes the three different, yet complementary, empirical approaches we take and the conclusions drawn from each one. In short, we find no evidence that expanding income tax breaks for high-income seniors is ‘good’ for state economic growth and, in fact, it may even be harmful.
The tax breaks targeting elderly taxpayers occur in both federal and state income tax laws and fall into three categories. Table 1 summarizes their prevalence at the state level and how much they have changed during the period covered by our study (1977–2015). The first is an extra exemption, deduction, or tax credit given on the basis of age. These extras have been in the federal and most state tax codes since the 1950s, tend to be modest in size, and have been relatively stable.7
The second is preferential treatment of Social Security benefits (SSB), which are a major source of income for lower- and moderate-income seniors. At the federal level, SSB were entirely exempt from income taxes until 1982 when the Social Security Act of 1982 began taxing a portion of SSB for those single/married households with ‘combined income’ above $25,000/$32,000.8 In 1993, a second set of income thresholds were set (at $34,000/$44,000), above which an even larger portion of SSB is taxed. As Table 1 shows, nearly all states followed the federal tax code prior to 1982 (treating them as tax free). After 1982, a minority of states began taxing them at either the federal (or lower) level. The number of states that tax SSB at all has steadily declined in recent years and removing the remaining taxes has been a commonly proposed expansion. In 2022 alone, laws reducing or eliminating taxes on SSB have been passed in Nebraska, New Mexico, and North Dakota—three of the 14 states that still levied any tax on SSB in 2015 (the last year of our study).
The third type of tax breaks are exemptions for ‘retirement income,’ which is defined differently across the states, but typically includes pension income, and sometimes also includes IRAs, interest and dividend income, and even a small amount of labor income. As Table 1 makes clear, these exemptions have grown in both prevalence and size in the decades covered by our study. States have continued to expand these tax breaks since 2015. For example, in 2022, Connecticut, Iowa, Maine, and Maryland all reduced or eliminated the tax on ‘retirement income’.
Because state tax codes include complexities and interconnected features, looking at a specific type of tax break in isolation can be problematic. For example, some states include SSB in ‘retirement income’ which reduces the generosity of any specific exemption level.9 For that reason, as well as to ease interpretation, our analyses use a summary measure that reflects the combined effect of different features of the income tax code.
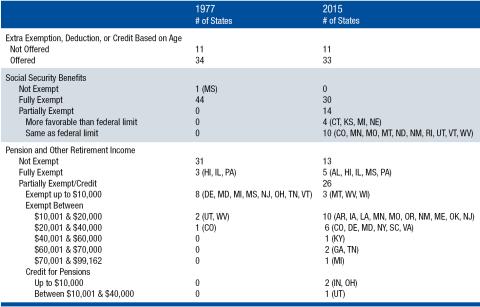
Notes: Table includes all 50 states plus DC. In 2015, 41 states plus DC levied an income tax whereas NH and TN had more limited income tax systems, for a total of 44. AK eliminated its income tax in 1980, so there were 45 in 1977. AK, DC, HI are not included in our econometric analyses. Amounts given are for a married household; singles are generally half of the amount. Source: Table 1 in Brewer et al. (2022), which is based on Bakija (2017).
As the quotes above suggest, proponents of senior tax breaks often argue that they will affect seniors’ decisions to remain in or move to the state. The assumption is that retaining and recruiting seniors provides an economic stimulus: their accumulated wealth and demand for goods & services in turn translates into more sales, property, and other types of tax revenues. However, as most seniors are retired, their presence adds to the demand for goods and services (including housing and health care) but perhaps without adding much to the productive capacity of the state economy.
Another consideration is that relatively few elderly—approximately 1 percent or less—move across state lines in any given year. The effects of migration on the state’s economy therefore seems likely to be small. On the other hand, the behavior of all senior citizens may be affected by these tax policies. More favorable income tax treatment may affect their retirement and housing decisions and other consumption behavior. For example, if these tax breaks encourage early retirement they could reduce the available labor force and thus productive capacity of the state. The behavior of the entire elderly population (and not just the 1 percent who move) seems likely to have a much larger potential impact on state economic growth. Yet, the direction of that effect on local economies is far from clear and is thus an empirical question.
Our article provides three different kinds of empirical evidence in an effort to answer the basic question of whether these tax breaks are ‘good’ for economic growth. Specifically, we investigate whether the reduced tax liabilities for those over age 65, resulting from changes in both state and federal tax breaks, are related to changes in state economic growth. We use three alternative empirical methodologies, each with its own advantages and disadvantages, to estimate the effects on state economic growth.
Perhaps the most straightforward approach is to identify situations where a tax break is changed and then see if we detect any change in growth afterwards. The first example is Indiana in 1982, which nearly doubled its refundable tax credit for seniors from $50 to $90.10 This tax change would lower the tax liability of all seniors but have the biggest proportionate impact on lower-income seniors. A second example is Kentucky, which in 1995 enacted a $12,500 pension exemption. This tax change would likely only reduce the tax liability for higher-income seniors, as most lower and moderate income seniors rely primarily on SSB which were already tax exempt.Our first analysis simply examines the pattern of state economic growth (as measured by personal income) before and after the tax change and compares it to the national average.11 This exercise is shown in Figures 1A and 1B below. In both cases, there is no evidence that the state experienced more or less economic growth than the national average after the policy change. It therefore provides the first simple evidence that these tax breaks do not obviously promote economic growth.
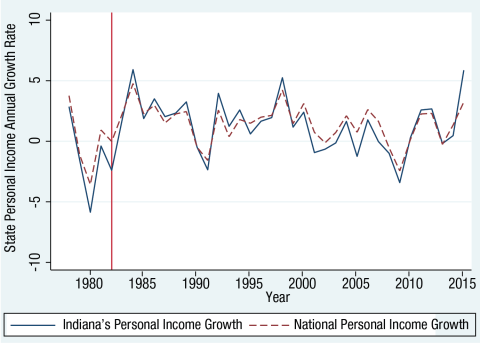
Note: Vertical red line indicates enactment of tax credit expansion.
Source: Appendix Figure 2a, ii in Brewer et al. (2022).
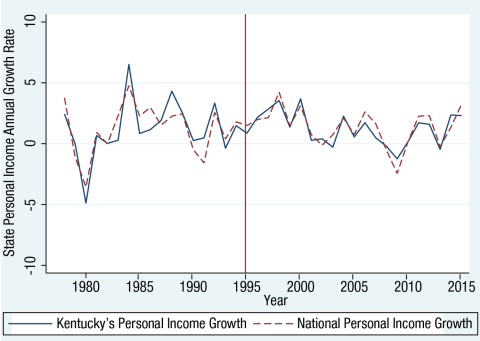
Note: Vertical red line indicates enactment of pension exemption.
Source: Appendix Figure 2b, ii in Brewer et al. (2022).
The above exercise, while intuitive and simple to understand, suffers from several limitations. It is limited in terms of the number of states, policy changes, and years it considers, and it does not control for other factors that may be affecting state economic growth. Most of the policy changes do not occur within a vacuum; these tax breaks are enacted alongside other tax law changes. And, in fact, changes to other aspects of the tax code, such as the statutory tax rates, can lead to an increase or decrease in the tax “benefit” of being elderly (i.e., the lower tax liability owed by seniors relative to a non-senior taxpayer of similar income).
We therefore construct a summary measure of the tax benefit of being elderly in each state and year, from 1977–2015. Using Current Population Survey data, we create annual financial profiles (level and sources of income) of elderly households at different points in the national income distribution (e.g., 25th percentile, median, etc.). Using a tax calculator tool,12 we then calculate the state income tax liabilities these profiles would face in every state and year along with the liability they would face if they were not over age 65 and their income came from sources that don’t receive favorable treatment. These calculations show that an elderly household faces a tax rate that is on average 2 percent lower than an equivalent non-elderly household. Two percent may not sound like much, but state average income tax rates are low such that this difference effectively wipes out the tax liability of the median elderly household and reduces the liability of those seniors at the 90th percentile by nearly half.
These estimated tax liabilities for elderly and equivalent non-elderly households at different points in the income distribution are then included in econometric models that estimate the factors affecting state economic growth. This method allows us to control for a wide variety of state-level and time-varying factors that could also influence growth, which helps us identify the unique impact of these policies.
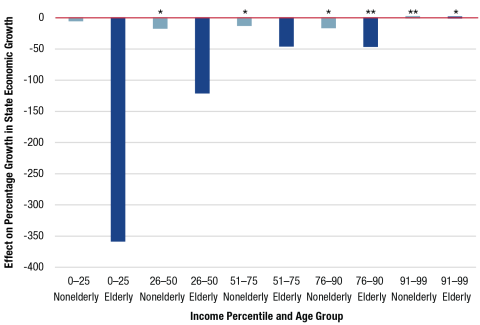
Figure 2 summarizes the results from our primary model.13 In particular, it shows the effects on the growth in state personal income of a $100 increase in the income tax liability for different age and income groups. Not surprisingly, an increase in income tax liabilities in general tends to slow economic growth (the estimated effects are mostly negative). However, this figure shows that taxing low-income non-elderly households is the most harmful for growth, reducing personal income growth by 0.166 percent for every $100 increase in tax liabilities. Even more stunning, a $100 increase in the tax liability of the richest (top 90th percentile) elderly households could actually increase state economic growth. The patterns are consistent across the different groups; taxing elderly and/or higher-income taxpayers has less detrimental effects on growth than non-elderly and/or lower-income groups.
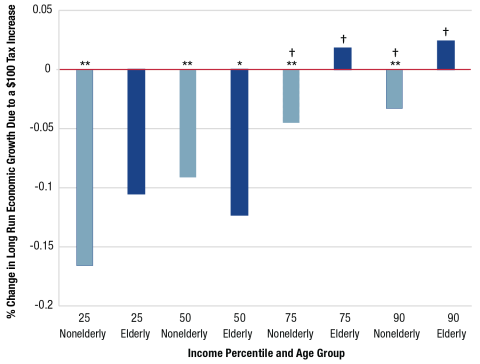
Note: Double asterisks (**) denote statistical significance at the 5% level; single asterisk (*) denotes statistical significance at the 10% level. Dagger symbol (†) indicates Nonelderly & Elderly statistically different. Source: From estimates reported in Table 2, columns 2–5, in Brewer et al. (2022).
Note: Double asterisks (**) denote statistical significance at the 5% level; single asterisk (*) denotes statistical significance at the 10% level. Source: From estimates reported in Table 4, columns 1–5, in Brewer et al. (2022).
So far, our analyses have focused on the effects of state income tax policies. As such, they are subject to the criticism that states choose to enact these policies and the state’s economic outlook may influence those choices. Perhaps state policymakers enact these policies because growth is lagging or they fear it soon will. In other words, the relationship between tax changes and economic growth could run the other direction.
To address this concern, our final exercise looks at the effect of changes in federal income tax policies—specifically the resulting change in federal tax liabilities owed by age and income group—on state economic growth. State governments do not choose these policies. Moreover, households cannot avoid their effects by moving to a different state, which effectively shuts down interstate migration as a possible mechanism for affecting state economic growth. Yet, states are going to be affected differently by these policies because their demographic make-up differs. For example, a federal tax change that increases the tax liability of higher-income elderly households—such as the 1993 law that increased the taxation of SSB for the highest income elderly—will have the strongest effects on states that have a disproportionately large number of high-income seniors.
To capture these likely effects, we focus on two specific periods of federal tax policy change that disproportionately affected certain age and income groups. First is the 1993 federal law (SSA 1993) that increased the taxation of SSB for high-income seniors (described earlier). Next is the 2001 tax cut (EGTRRA 2001) that reduced the tax liabilities of lower-income, non-elderly households much more than other groups. By selecting policy changes that affected households differently by age and income group, we can explore whether these policies affected state economic growth in those states with a disproportionate number of those households. Using the 5 percent IPUMS sample of the 1990 and 2000 decennial census data, we calculate the change in tax liabilities of different age and income groups living in every state as a result of the tax law changes. We then estimate the effect that the change in these tax liabilities had on state economic growth.
Figure 3 summarizes the effects of this exercise.14 Despite the dramatic differences in our empirical approach and the practical effects of these policies (e.g., federal tax cuts can be financed by increasing government debt while state ones typically cannot; more generally, we do not how these dollars were spent/financed), the message is reasonably similar. Taxing higher-income taxpayers is less harmful for economic growth, while taxing the poorest—especially the poor elderly—is the most harmful.
All three of our empirical approaches yield similar conclusions—that decreasing the taxes on lower-income groups, perhaps especially the low-income elderly, is the most beneficial for state economic growth. Despite the rhetoric of some policy advocates, however, the state income tax breaks currently being proposed and adopted do not target this group and instead benefit high-income elderly. Low-income elderly do not currently pay much in state income taxes because their primary source of income, Social Security benefits, is not subject to tax.15 Therefore, the proposed tax breaks—e.g., eliminating taxes on all SSB (for those higher-income taxpayers whose SSB are still subject to tax) or increasing the ‘retirement income’ exemption—only benefits higher-income elderly. And here again our results are unanimous in finding that these policies are the least helpful and may even be harmful for economic growth. To provide economic relief to low-income elderly households, states would need to enact income-based refundable tax credits similar to the Earned Income Tax Credit available to low-income working households. Our study suggests that expanding such tax credits would likely be more beneficial for economic growth.
- B. Brewer, K. Conway , and J. Rork, “Protecting the vulnerable or ripe for reform? State income tax breaks for the elderly?then and now,” Public Finance Review, 45(4), 564–594 (2017).
- See https://www.krqe.com/news/politics-government/legislature/proposed-bill-eliminates-social-security-tax-for-seniors/.
- The law becomes effective in 2023 and applies to those who are disabled or over the age of fifty-five.
- See https://www.msn.com/en-us/money/news/2-states-that-soon-might-eliminate-retirement-income-taxes/ar-AATKLsl.
- See https://www.fitsnews.com/2018/01/08/yancey-mcgill-south-carolinas-golden-opportunity/.
- B. Brewer, K. Conway, and J. Rork, “Do income tax breaks for the elderly affect economic growth?” Contemporary Economic Policy, 40(1), 7–27 (2022). Available from: https://doi.org/10.1111/coep.12549.
- K. Conway and J. Rork, “The genesis of senior income tax breaks,” National Tax Journal, 65(4), 1043–1068 (2012). The most notable change in federal law came with the Tax Reform Act of 1986, which replaced the extra exemption with an extra standard deduction—which only benefits taxpayers who do not itemize.
- “Combined Income” equals the sum of gross income, tax?exempt interest, and 50% of SSB. Households above the $25,000/32,000 (single/married) threshold must pay tax on $.50 of every dollar that their combined income exceeds the threshold up to a maximum of 50% of SSB. The second thresholds ($34,000/44,000) operate similarly, taxing SSB at a rate and maximum of 85%. For further discussion, see T. Page and K. Conway, “The labor supply effects of taxing social security benefits,” Public Finance Review, 43(3), 291–323 (2015).
- A state that exempts $50,000 in ‘retirement income,’ for example, is offering a larger tax break if that $50,000 does not include SSB—since SSB is likely exempt from taxes already. In such states that do not include SSB in the definition, taxpayers’ SSB and another $50,000 in other forms of retirement income are exempt from taxation.
- Being ‘refundable’ means that the taxpayers’ liability can actually be negative—i.e., the government can owe the taxpayer money. This feature is critical because most low-income seniors have zero tax liability already, so a nonrefundable tax credit will have no impact. Being refundable means that every taxpayer either pays less in taxes or receives more from the government.
- Brewer, Conway, and Rork (2022) also uses a ‘synthetic control’ as a comparator (Figures A.2a and A.2b). A synthetic control is a constructed average of states that most closely mimics the growth pattern of the state of interest (Indiana or Kentucky) before the policy change. It is therefore viewed as a better comparator than a simple national average. The results are similar.
- National Bureau of Economic Research’s TAXSIM calculator (Feenburg & Coutts).
- See Table 2 in Brewer, Conway, and Rork (2022).
- See Table 4 in Brewer, Conway, and Rork (2022).
- Even in the few states that still tax SSB, low-income elderly households do not have high enough incomes for them to be subject to the state’s tax.
About the Authors
- Ben Brewer is an assistant professor of economics at the University of Hartford.
- Karen Conway is the John A. Hogan Distinguished Professor of Economics at the University of New Hampshire.
- Jon Rork is the George Hay Professor of Economics at Reed College.
The authors thank Sam Croteau and Bayarmaa Dalkhjav for excellent research assistance, Michael Ettlinger for helpful comments, and Jess Carson and Laurel Lloyd for editorial assistance.