Table of Contents
A place’s demographics are the characteristics of its population, including its size, age structure, racial-ethnic makeup, and migration patterns. For New Hampshire to thrive, groups such as policymakers, businesses, and nonprofits must be aware of the state’s demography and demographic trends as they consider the needs of its people, institutions, and organizations. Demography may not be destiny, but there is peril in ignoring it.
This section of What is New Hampshire?, which is substantially based on previous work by Ken Johnson of the Carsey School of Public Policy, describes the major characteristics of the state’s demographic makeup, looks at recent trends, and highlights some challenges we may face moving ahead. A major resource for understanding these characteristics is the Decennial Census, although data from the 2020 Census are still being released. This report utilizes some of those data, supplementing with data from 2019 as needed. For additional 2020 data, readers can reference our ongoing series of Carsey Briefs (Brief 1, Brief 2, Brief 3, Brief 4).
As with all parts of What is New Hampshire?, we welcome feedback on how this section may be improved. Are there areas of demography that you’d like us to cover in more detail or other challenges that we should highlight? Please let us know by emailing Carsey.WINH@unh.edu.
Throughout this section supplemental information can be accessed by clicking on the blue boxes indicating further data are available. Additional explanatory text can be accessed by clicking on the "+" next to its description.
New Hampshire Now
New Hampshire was home to 1.38 million residents in 2020, making it the 41st most populous state, slightly smaller than Hawaii and slightly larger than Maine. Granite Staters are clustered in its three metropolitan counties, with 63 percent of the population residing in Hillsborough, Rockingham, and Strafford Counties.
Table 1. Median Age, New England and United States, 2019
Source: U.S. Census Bureau, 2019 Population Estimates
Age
New Hampshire is the second-oldest state in the nation, with a median age of 43.1 (Table 1), and 18.7 percent of residents are 65 and older, compared with 16.5 percent nationwide. However, as shown in Chart 1, the state’s age distribution is older because a larger share of its population was born during the baby boom and is now age 55-75, as well as because it has relatively few younger adults, especially those age 25-40. This distribution contrasts with the distinctly more bell-shaped population distribution for the United States as a whole (Chart 1), where a wider population base of children and young adults results in a younger distribution.
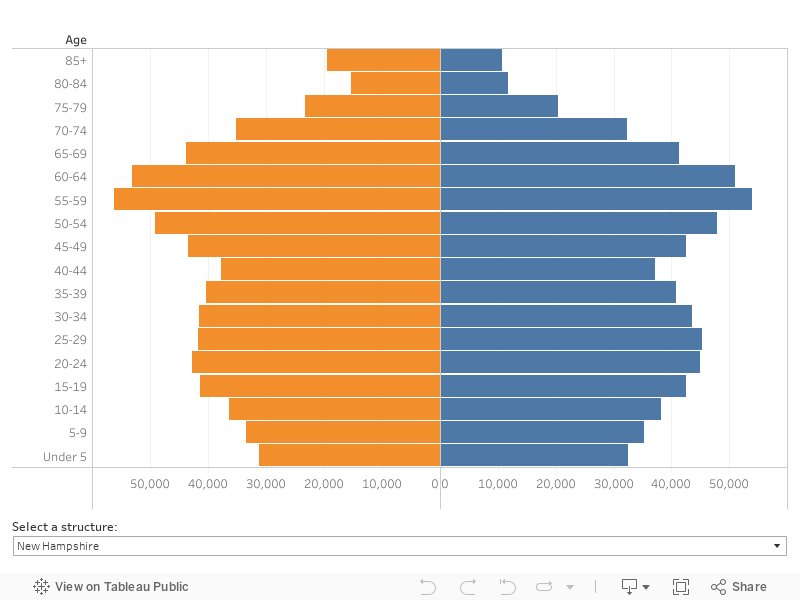
Chart 2. Race-Ethnicity in New Hampshire, 2020
Source: U.S. Census Bureau, 2020 Decennial Census
Table 2. Race-Ethnicity in New England and United States, 2020
Source: U.S. Census Bureau, 2020 Decennial Census
Table 3. Share of Residents by Place of Birth, 2015-2019
Note: U.S., Not State of Residence also includes the small share of U.S. natives born abroad of American parent(s). Source: U.S. Census Bureau, American Community Survey, 2019 five-year estimates
Migration
New Hampshire is often characterized as a place where residents’ lineage goes back generations, but the state has one of the most mobile populations in the country. Only 41.3 percent of the state’s residents were born in New Hampshire, far less than the average across New England states (54.3 percent) or the average for all states (57.2 percent) (Table 3). Among those over the age of 25, only about one-third were born in the state (32.5 percent).
Table 4. Percent of New England and U.S. Population Age 25 or Older with At Least a Bachelor's Degree
Source: U.S. Census Bureau, American Community Survey, 2019 five-year estimates
Education
Granite Staters are relatively well educated; more than one third of New Hampshire adults have at least a bachelor’s degree (Table 4), a share placing it in the top 10 most educated states. Although high by national standards, this share of college-educated adults is more average for New England and lags substantially behind Massachusetts.
New Hampshire Trends Back to Top
The Pace of Demographic Change in New Hampshire
Although migration data from 2020 weren’t yet available at publication time, data from 2019 show how the population of New Hampshire has changed. New Hampshire gained 43,000 residents (a 3.3 percent increase) between 2010 and 2019, and the population hit 1,359,711 by July 1, 2019, according to the Census Bureau. This recent population gain, modest compared to the annualized gains in each of the previous four decades (Chart 3), is the result of two related but distinctly different demographic processes. The first is natural increase, which is the excess of births over deaths. Natural increase has contributed to overall population growth in New Hampshire throughout the state’s history, but it has diminished over the past several decades. With less natural increase, the state now depends increasingly on the second demographic component of change, net migration, which is the difference between the number of people who move into New Hampshire and the number who leave. Migration has long been important to New Hampshire, but it is far more volatile than natural increase and can change abruptly in response to shifts in the economy.
Chart 3. New Hampshire Demographic Change (Annualized), 1970 to 2019
Source: Census Bureau, Decennial Census 1970-2010 & 2019 Population Estimates
Migration includes both domestic migration—the movement of people between locations in the United States—and immigration from abroad. Net immigration is the difference between the number of people coming into an area from outside the country and the number of people leaving the country from that area. Each of these components contributes to the overall migration gain or loss for the state. Immigration was important to New Hampshire early in its history and again at the turn of the 20th century, but it has played a very minor role in overall migration gains during the last half-century. In 2019, only 6.1 percent of New Hampshire’s residents were foreign born, compared to 13.6 percent of the U.S. population. Immigration played a more prominent role during the Great Recession and its aftermath not because it surged but because domestic migration diminished substantially. In recent years, domestic migration has rebounded, though not to the levels of earlier decades.
Natural increase peaked in the 1980s, when births exceeded deaths by about 7,200 annually. Its contribution diminished after that and by the 2010s, there were only about 900 more births than deaths annually. Although natural increase was significant in the boom decades of the 1970s, 1980s, and 1990s, migration accounted for the majority of the state’s population increase even then. For example, when the state’s population grew by almost 25 percent during the 1970s, migration accounted for nearly 75 percent of the gain. The slowdown in population growth during the 1990s was primarily due to dwindling migration gains. In the first decade of the 21st century, natural increase actually exceeded net migration as a source of the state’s modest population gain, due not to a surge in natural increase but to a precipitous slowdown in net migration resulting from the Great Recession. Net migration again accounted for most of the population growth between 2010 and 2019, though the population gain was far smaller than in the past.
The Impact of the Recession on New Hampshire Demographic Trends
The long-term trends above show that both natural increase and migration have played important roles in the growth of New Hampshire’s population. However, recently population growth has been uneven. Between April 2000 and July 2003, the state gained an estimated average of 13,300 residents annually. But in 2007-2010, years roughly coinciding with the Great Recession, the annual population gain diminished to just 1,400, though it has recovered recently (Chart 4).
Chart 4. New Hampshire Demographic Change, 1970 to 2019
Source: U.S. Census Bureau, Decennial Census, 2000 & 2010, 2019 Population Estimates
The Great Recession had a profound impact on the state’s demographic trends. In New Hampshire, as elsewhere in the United States, falling fertility rates during the downturn resulted in less natural increase—a trend reflected in the diminishing annual rates of natural increase in Chart 4. Recent research suggests that the fertility reductions that began during the recession are continuing. In contrast to this steady decline in natural increase, net migration was volatile during the recessionary and post-recessionary periods. From 2000 to 2003, the net migration gain was 8,600, but by 2007-2010 the state had a net migration loss of more than 2,100 migrants annually. This migration reversal occurred because Great Recession job losses, diminished retirement accounts, and a severe slump in housing prices made it difficult for people to move. As a result, states such as New Hampshire that had long enjoyed a net influx of migrants saw the inflow of new residents dwindle. As the Great Recession’s impact on New Hampshire began to wane, migration was rejuvenated, and population gains increased. By 2014-2019, the annual net migration gain was nearly as great as between 2000 and 2003. However, natural increase was minimal, so the population gain was considerably smaller than it had been just before the recession.
Recent Census Bureau estimates illustrate how much New Hampshire’s demographic trends have changed in the last few years. The state’s population grew by more than 5,000 annually between July 2018 and July 2019 (Chart 5). Migration accounted for all the gain: the state had a net domestic migration gain of 3,600 annually between 2018 and 2019 compared to just 100 between 2012 and 2014 and a net domestic migration loss earlier in the decade. New Hampshire also received 2,100 immigrants from other nations between 2018 and 2019, somewhat fewer than in the past. In contrast, births in New Hampshire no longer exceed deaths. Thus, natural change has been a natural decrease that has diminished recent population gains.
Chart 5. Components of Demographic Change in New Hampshire, 2010 to 2019
Source: U.S. Census Bureau, 1970-2019 Population Estimates
The declining contribution of natural increase to New Hampshire’s population growth is illustrated in Chart 6. In the 1970s, the 1980s, and particularly the 1990s, there were many more births than deaths in the state. In 1990, for example, 17,800 births and just 8,400 deaths produced a natural gain of 9,400. Births diminished over the rest of the decade before stabilizing at between 14,000 and 15,000 through 2008. Following the onset of the Great Recession, births dropped sharply in New Hampshire because fertility rates were low and the child-bearing-age population did not grow. Between 2011 and 2019, New Hampshire averaged just 12,400 births a year while deaths, which had slowly increased from 1980 to 2008, turned sharply upward in 2009 because of population aging and rising drug-related mortality. The recent decline in births coupled with the uptick in deaths resulted in natural decrease which reduced the population by 200 people annually between 2018 and 2019.
Chart 6. New Hampshire Births and Deaths, 1970-2019
Source: U.S. Census Bureau, 1970-2019 Population Estimates
Demographic Change Is Spatially Uneven Across New Hampshire
The pace of population change in New Hampshire is geographically uneven. Many fast-growing areas are concentrated in the southern and central parts of the state (Map 1), while slower growth or population loss characterize the northern part of the state and the area along the Connecticut River. Population gains in New Hampshire are stimulated by two factors. The first is the peripheral sprawl of the Boston metropolitan area; population growth rates are high in a broad band around the outer edge of the Boston metropolitan area, including much of southeastern New Hampshire. The second is the attraction of recreational areas in central New Hampshire. The selective de-concentration of population in the state is consistent with national trends, which show high growth in lower-population-density recreational areas and along the urban edge coupled with population stagnation or loss in remote lower-population-density areas that depend on extractive industries such as forest products, farming, and mining. The data also show that though population growth diminished across the state between 2010 and 2020 compared to 2000 to 2010, many of the patterns of population redistribution remain consistent. Areas with population growth between 2000 and 2010 often continued to grow after 2010, but population gains were smaller. In contrast, areas that lost population or grew slowly between 2000 and 2010 were more likely to lose population or gain less in the later period.
Map 1. New Hampshire Population Change, 2000-2010 and 2010-2020
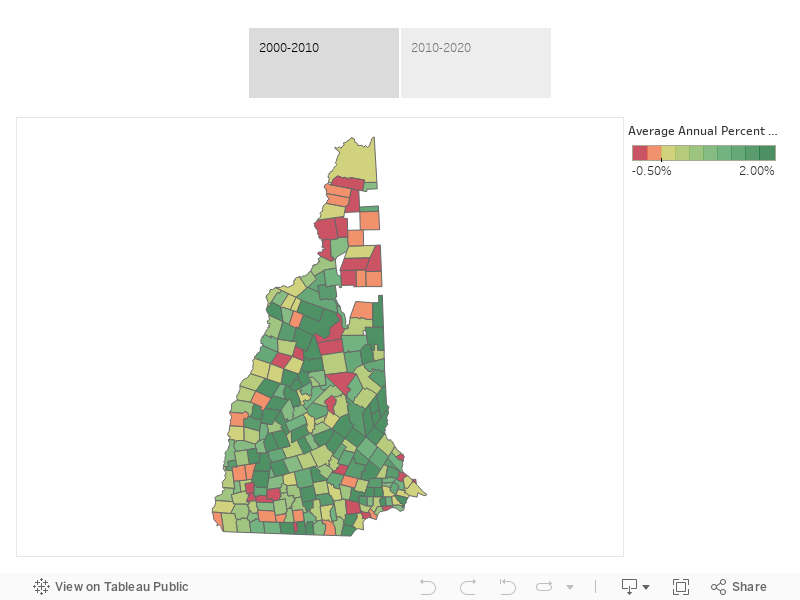
Note: Areas depicted in white have zero population in one or both periods. Source: U.S. Census Bureau, 2000, 2010, and 2020 Decennial Census
Population changes occurring in three New Hampshire counties further demonstrate how spatially uneven demographic change has been (Chart 7). Carroll County, an amenity-rich area easily accessible from large urban centers in southern New England, grew substantially over each of the last several decades because of its appeal to amenity migrants. Growth slowed considerably between 2010 and 2019, but Carroll still showed a modest population gain during the period. The entire gain was fueled by net migration, which offset the excess of deaths over births.
Chart 7. Demographic Change for Hillsborough, Carroll, and Coös Counties, 2010 to 2019
Source: U.S. Census Bureau, 2019 Population Estimates
In northernmost Coös County, wood and paper products were long the mainstays of the local economy, with large mills employing generations of residents who processed the timber of the vast northern forests. Today, the mills are largely gone and the county lost population between 2010 and 2019, primarily because deaths exceeded births but also because there was only a very small net inflow of migrants. Yet, Coös County is situated in a scenic region with ski areas and grand old resorts that have welcomed generations of vacationers and now amenity migrants. There are efforts underway to facilitate more regional cooperation to attract new business and migrants to these areas, and so their demographic future remains in flux.
Hillsborough County, with 417,025 residents in 2019, is the most populous in the state. It includes the state’s two largest cities—Manchester and Nashua—as well as a substantial suburban population, and over the past several decades, the proximity of both cities to Boston has contributed to their growth. Between 2010 and 2019, Hillsborough County grew modestly because there were more births than deaths in the county and a modest net migration gain.
New Hampshire’s Changing Age Structure
New Hampshire is growing older. The ranks of adults in their 50s, 60s, and 70s has expanded substantially over the past 20 years, reflecting the aging of the Granite State’s large baby boom population (Chart 8). In contrast, both the cohorts of children (0-19) and their parents (40-49) diminished. The population age 20-29 grew modestly, in part because the large birth cohorts of the early 1990s were in their late 20s.
Chart 8. Population Change in New Hampshire by Age, 2000-2019
Source: Census Bureau, 2000-2010 Census, and 2019 Population Estimates
Because New Hampshire’s age structure has significant long-term policy implications, it is important to examine it (Chart 9).
Chart 9. Age Structure of Population in New Hampshire, 2019
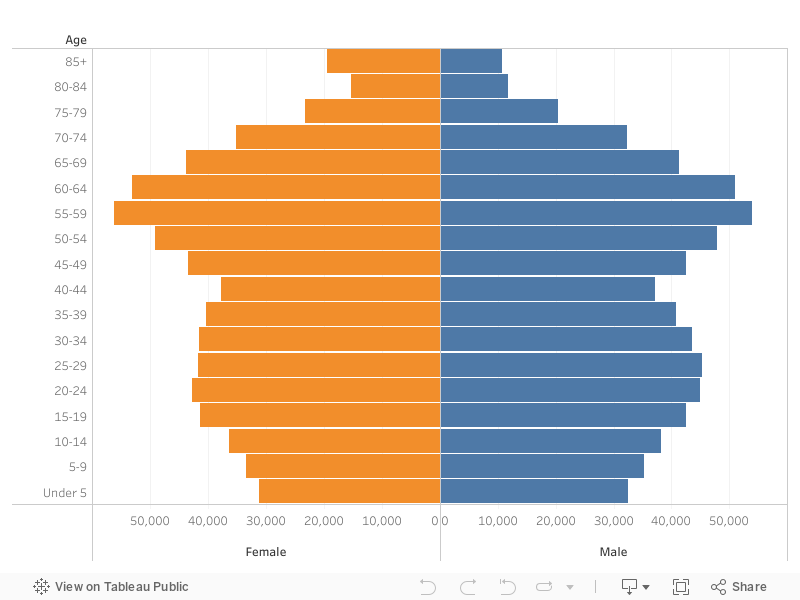
Source: Census Bureau, 2000-2010 Census, and 2019 Population Estimates
One important consideration for policymakers is that the number of older adults will increase rapidly in the next two decades. In 2019, the two large baby boom cohorts in their 50s (207,000 residents) and the two in their 60s (189,000 residents) represented nearly 30 percent of New Hampshire’s population. These cohorts were larger than the population age 70-79 in 2019. Although mortality and migration will modestly diminish these baby boom cohorts over the next few years, the vast majority will celebrate their 70th birthdays in New Hampshire. As a result, the state’s older population will more than double over the next 20 years.
In contrast, the cohorts that were age 20-39 in 2019 comprise considerably fewer people, primarily because of the lower birth rates of the 1980s. As the large baby boom cohorts continue to disengage from the labor force, New Hampshire is likely to face significant challenges maintaining a labor force of sufficient size to support a growing economy unless the existing population is supplemented by additional migration.
These age-structure shifts are not occurring evenly across the state. Northern and central New Hampshire have a substantially larger proportion of residents age 65 and over than do other parts of the state (Map 2). Much of this pattern is a function of aging in place among current residents of these regions, coupled with a continuing loss of young adults. In some areas there has also been an inflow of older migrants. In these regions, local governments and organizations are the first to confront the challenge of an aging population. However, although the proportion of older adults is larger in the north, the vast majority of older adults reside in southern and central New Hampshire. In contrast, children represent a significantly larger part of the population in southeastern New Hampshire, both proportionally and in absolute numbers (Map 3); the largest concentrations reside near the Massachusetts border. Because this region represents the outer edge of the Boston suburbs and includes Manchester, Nashua, and the Seacoast region, it attracts and retains a significant family-age population. Here, funding school construction and expansion is likely to be a matter of more immediate concern than in the northern areas of the state.
Map 2. Percent of Population Age 65 and Older, 2019
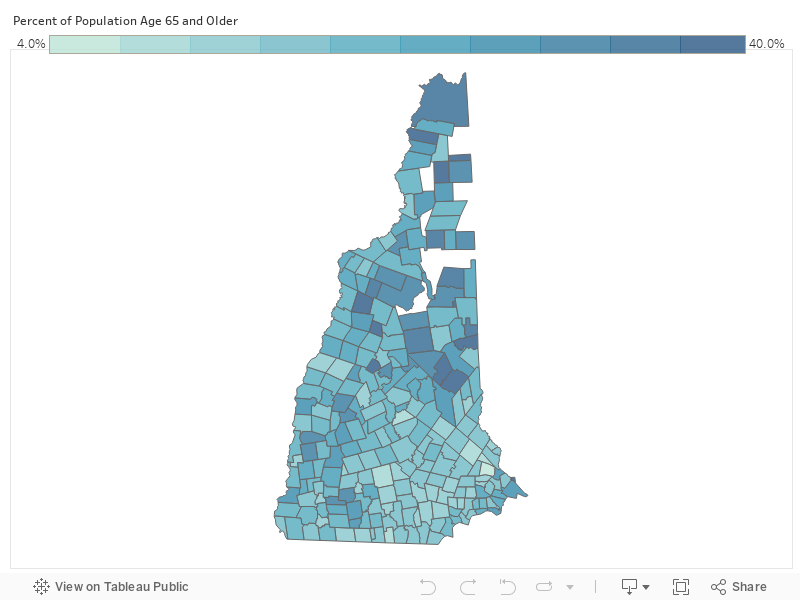
Note: Areas depicted in white have zero population. Source: U.S. Census Bureau, American Community Survey, 2019 5-year estimates
Map 3. Percent of Population Younger than Age 18, 2019
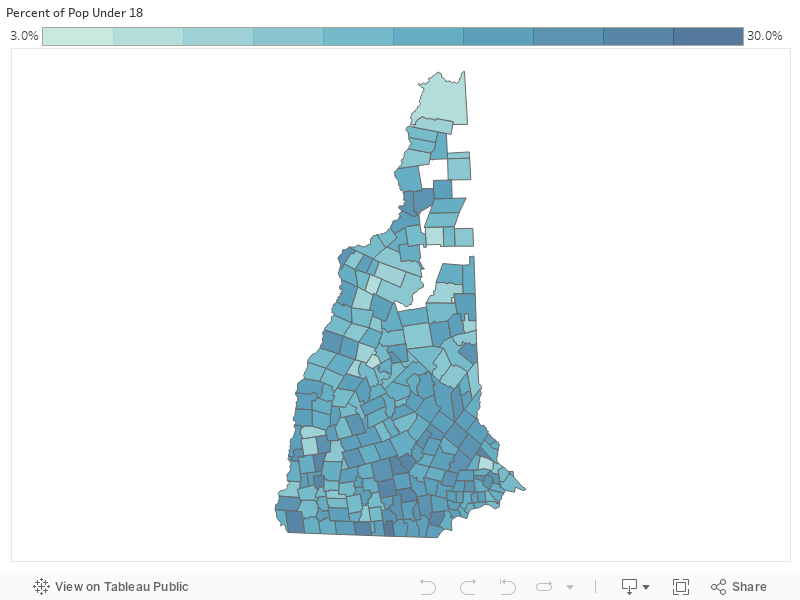
Note: Areas depicted in white have zero population. Source: U.S. Census Bureau, American Community Survey, 2019 5-year estimates
Aging in place is the most powerful influence on New Hampshire’s age structure, but it is not the only factor. The age structure is also influenced by the age-specific migration streams into the state, and in this regard, there are contrasts between the era of the Great Recession and more recent years. Historically, New Hampshire has received significant net inflows of people in their 30s and 40s together with their children, and it has received modest inflows of older adults. Migration patterns among those in their 20s have been uneven, however; indeed, the state lost modest numbers of 20-29-year-olds during the 1990s and 2000s.
As we have seen, New Hampshire recently began to receive a significant net inflow of people from other U.S. states. Compared to the recessionary and post-recessionary period of 2008-2012, the recent increase was greatest among those in their 20s, for whom migration gains averaged 1,800 a year between 2015 and 2019 compared to an average loss of over 1,500 annually from 2008 to 2012 (Chart 10). Among those in their 30s, the net annual migration gain more than doubled during the same period, while the net inflow of those age 40-49 diminished. As more family-age adults migrated to New Hampshire again, their children fueled a significant net influx of those under age 20. These recent domestic migration gains are modest compared to earlier time periods, but they contrast with those during the time of the Great Recession. (Note that these data are based on Census Bureau estimates and as such should be viewed with caution; a definitive analysis of age-specific migration patterns to the state will not be possible until the results of the 2020 Census are available for analysis).
Chart 10. New Hampshire Annual Net Domestic Migration by Age, 2008-2019
Source: U.S. Census Bureau, American Community Survey, 2012 and 2019 5-year estimates
Migration is important to New Hampshire’s future because it brings in younger people of working age at a time when the state’s workforce is aging. Moreover, in-migrants to New Hampshire have been better educated than those leaving and thus increase the state’s store of intellectual capital. Between 2015 and 2019, approximately 16,600 individuals with a bachelor’s degree or higher moved to the state annually (Chart 11), while roughly 12,000 individuals with similar academic credentials moved out. Even during the worst of the recession, New Hampshire had a net gain of migrants with a college degree or more, but the state’s gain has accelerated in the post-recessionary period.
Chart 11. Migration by Educational Attainment in New Hampshire, 2006-2010 and 2015-2019 (Age 25+)
Source: U.S. Census Bureau, American Community Survey, 2010 and 2019 5-year estimates
Relatively high education credentials characterize both U.S.-born and foreign-born migrants to the state. Compared to New Hampshire-born residents, both migrant groups are more likely to have a college degree and are more than twice as likely to have a graduate degree (Chart 12). Thus, the recent upturn in migration to the state brings more talented migrants to a state concerned about its aging labor force.
Chart 12. Educational Attainment of New Hampshire Residents Age 25 and Older by Place of Birth
Note: Estimated number born in New Hampshire is 312,000; estimated number born elsewhere in United States is 565,000; and estimated foreign born is 70,000. Source: U.S. Census Bureau, American Community Survey, 2019 5-year estimates
Recent New Hampshire Diversity Trends Back to Top
Although New Hampshire is one of the nation’s least racially diverse states, the 2020 Census shows that this continues to slowly shift in the state. Nationwide, the non-Hispanic white population declined from 69.1 percent to 57.8 percent between 2000 and 2020, a drop of nearly 12 percentage points. In New Hampshire the share dropped from 95.1 percent to 87.2 percent, a decline of almost 8 percentage points. Although this was only about two-thirds the pace of the national change, the effect was still substantial in the Granite State: the relatively small Hispanic population and population of color more than doubled from 60,500 in 2000 to 176,880 in 2020, accounting for over three-quarters of the total population increase in this period.
The biggest growth was in populations identifying as two or more races or as an “other” race that wasn’t listed. This group has steadily increased since 2000, although changes to data processing in 2020 complicate direct comparisons over time. Hispanics are the next largest racial-ethnic group in New Hampshire with 59,500 residents, or 4.3 percent of the population. The Asian population is 35,600 (2.6 percent), and Black or African Americans number 18,700 (1.4 percent). Each of these three groups more than doubled in size between 2000 and 2020.
Consistently, children are in the vanguard of the state’s growing diversity, due predominantly to the decline in births among non-Hispanic whites. In all, 15.7 percent of New Hampshire’s children belonged to a minority population in 2019 (Chart 13), with Hispanic, Asian, and multiracial Granite Staters representing the largest share. The greater diversity among children is the result of two diverging trends. First, the minority child population grew by almost 18,000 between 2000 and 2019, and second, the white youth population declined by almost 108,000. Because the minority youth gain was not sufficient to offset the loss of white youth numbers, New Hampshire’s child population declined by 89,700.
Chart 13. New Hampshire Population by Race and Hispanic Origin, 2019
Source: U.S. Census Bureau, 2019 Population Estimates
The proportion of the adult population that is minority is considerably smaller than the proportion of minority children. In 2019, 9 percent of New Hampshire adults belonged to a minority group. Hispanics were the largest of these groups, followed by those who identified as multiracial and Asians.
Looking ahead, the proportion of New Hampshire’s population that is minority will likely continue to grow for several reasons. For one, 20 percent of the population identifying their race as non-Hispanic white alone are over age 65 in 2019, compared to 6.9 percent of those identifying as Hispanic, Black, Asian, multiracial, or some other race. Since mortality rates are higher for older adults, the high proportion of older whites will mean higher numbers of white deaths than minority deaths in the future. For another, only 28.1 percent of non-Hispanic white women were of prime child-bearing age (20-39) in 2019 compared to 46.1 percent of women of color and Hispanic/Latina women. Although there are far fewer minority women than white women in New Hampshire, the larger proportion of minority women of prime child-bearing age increases the proportion of minority births.
Diversity is geographically uneven in New Hampshire. Large parts of the state remain almost completely non-Hispanic white, while Granite Staters of color represent a significant part of the population in the Concord-Manchester-Nashua urban corridor, the Hanover-Lebanon region, and a few areas of the Seacoast. This is especially true among the child population: for instance, in Manchester and Nashua, more than 38 percent of children are minority.
Conclusion
The future economic and social well-being of New Hampshire and its communities depends on our ability to anticipate change and respond appropriately. Though New Hampshire is a relatively small player on the nation’s huge demographic stage, there is much to learn from an analysis of the way the state’s population is growing and changing. The purpose of this demographic analysis is to inform policy and to contribute to the efforts of policymakers, planners, nonprofits, and businesses to consider the future needs of New Hampshire’s people, institutions, and organizations in ways that will allow the state to continue to grow, prosper, and be a good place to live and raise families.
Throughout this section, we rely on various sources of survey-based data. Readers should be cautious when comparing estimates between groups or time periods because these surveys are asked of a sample of the population, rather than the total population. Although some estimates may appear different from one another, it is possible that any difference is due to sampling error. Further, in some cases, very small differences may be statistically significant due to the large sample size of certain surveys. While it is not realistic to provide statistical testing results for each possible comparison that readers might make, we focus on differences that are substantively meaningful and statistically significant in the text. Data from the 2020 Census will continue to provide additional information on many of these trends, but as of this date, only limited data from the 2020 Census has been released. Future editions of What is New Hampshire will incorporate 2020 Census data and, in the meantime, readers are encouraged to stay up to date with Carsey Research Briefs.