Government budgets reflect choices made collectively through democratic processes. Through these budgets, we pool resources as a society to use for purposes that we either cannot or choose not to pay for individually. Examples include education, police, the social safety net, and public parks. Budgets set priorities and show what we value as a society. They are compromises—no one is ever completely pleased with a government budget—and the number of stakeholders involved in the budget process ensures that almost everyone can point to expenditures they believe to be a waste of money or areas they believe are underfunded. Similarly, we have yet to meet a person who thinks our tax system is perfect in the amount it collects, the way taxes are collected, or from whom.
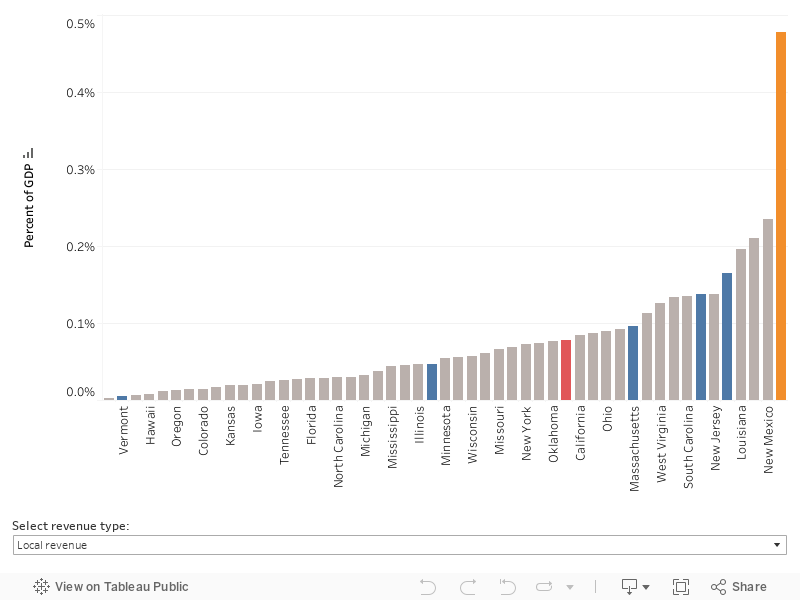
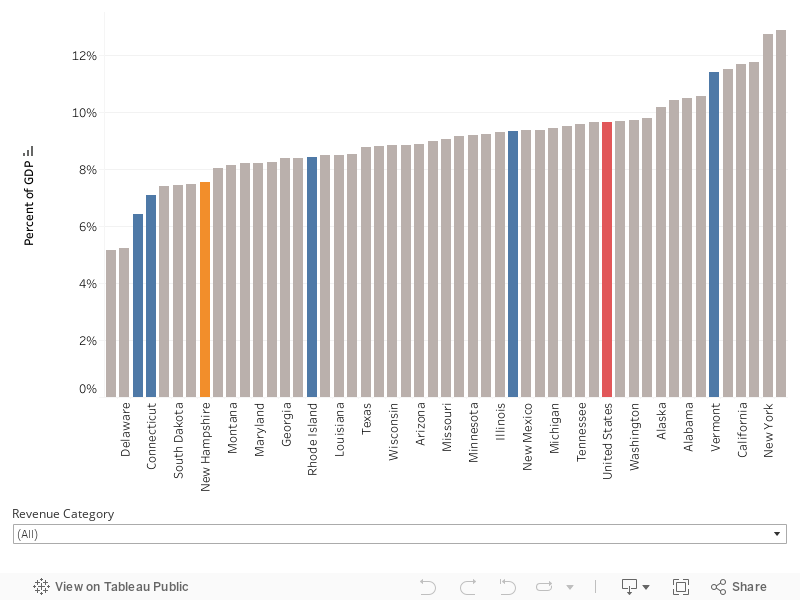
Compared to other states, New Hampshire has chosen to raise less revenue and spend less on public investments and services. State and local government spending make up a smaller share of the state’s economy than they do in all but three other states, and spending is low at both the state and local levels. State taxes are lower in New Hampshire than every other state except Alaska. Because low state taxes are somewhat offset by high local taxes and other revenue sources, however, the state ranks slightly higher—forty-fifth—in combined state and local revenue as a share of its economy. Nevertheless, New Hampshire local governments have fewer resources than those in most other states despite high local taxes, largely because they receive less from their state government than do local governments in all but four other states.
Overall levels of state and local spending and revenue, however, do not tell the entire story. There are also important choices, within overall spending and revenue, on what categories of spending to prioritize and what revenue sources to rely on most or least heavily. Localities across the state also vary significantly in their fiscal circumstances and priorities.
The choice to be a low-revenue, low-spending state has both positive and negative impacts—as do the choices about what to spend public money on and how to tax. This section of What is New Hampshire? does not assess the impact of those choices but describes the major features of the budgets of the governments of the state, including current spending and taxes, recent trends, and some potential challenges we may face moving ahead.
As with all parts of What is New Hampshire? we welcome feedback on how this section may be improved. Are there areas of the budget that you’d like us to cover in more detail or other challenges that we should highlight? Please let us know by emailing Carsey.WINH@unh.edu.
Table of Contents
- Impact of COVID-19
- Data Sources and Years
- NH Spending and Revenue at State and Local Levels
- State and Local Spending in 2019
- NH Government Spending
- NH Local Government Spending in 2019
- State and Local Revenue
- State Government Revenue in 2019
- State Funds in 2021
- Local Government Revenue in 2019
- Summary of Spending and Revenue in NH
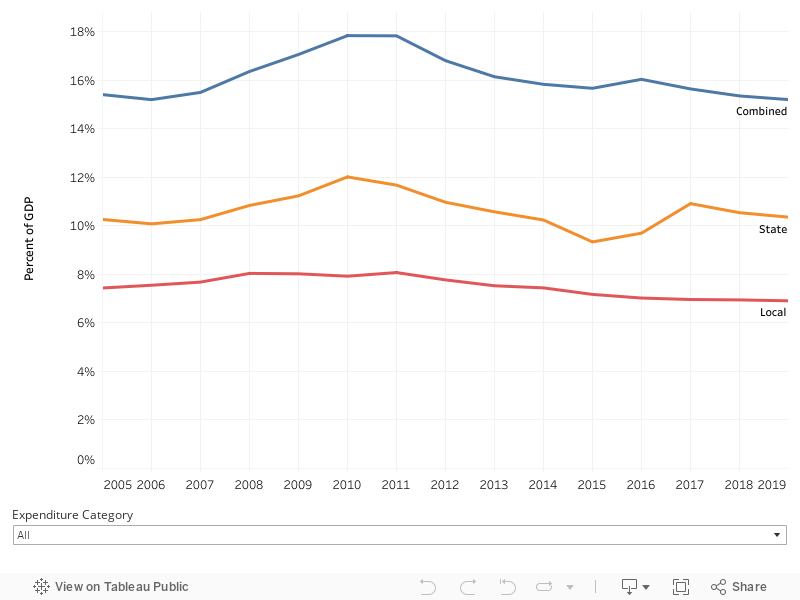
- Long-Term Budget Trends
- New Hampshire Challenges
- Conclusion
- Footnotes
Throughout this section supplemental information can be accessed by clicking on the gray boxes indicating further data are available. Additional explanatory text can be accessed by clicking on the "+" next to its description.
Impact of COVID-19 Pandemic
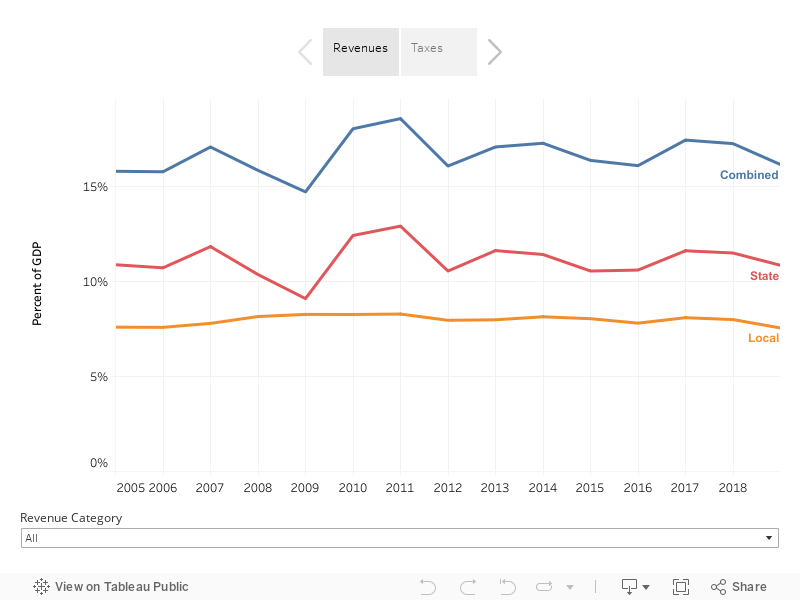
COVID-19 has had substantial health- and economic-related impacts on government budgets at every level all over the world. New Hampshire is no exception. Early in the pandemic, state revenue was down significantly in the Granite State [1], and despite fears that would continue, overall tax revenues in New Hampshire in 2020 were only 1.7 percent below 2019, though that was a greater drop than the national average of 0.4 percent [2]. The effects of the pandemic on government budgets will continue to be felt in years to come, including the legacy of the massive infusion of fiscal assistance from the federal government.
Data Sources and Years
In the analysis below we rely on data collected by the U.S. Census Bureau’s Annual Surveys of State and Local Government Finances as well as data provided by the state of New Hampshire. The Census Government Finance data are used when comparing across states or when local governments are included in the analysis, while data from the state of New Hampshire are used only when examining state government in isolation [3]. In the case of the Census Bureau’s Annual Surveys of State and Local Government Finances, 2019 is the most recent year of data available. This offers a view of New Hampshire’s state and local revenue and spending, relative to other states, before the turmoil resulting from COVID-19 and governments’ responses.
New Hampshire Spending and Revenue at the State and Local Levels
Granite Staters rely on their state and local governments to provide infrastructure, social insurance programs, education, fire and police services, and more. The budget choices made at the state and local levels in New Hampshire are highly intertwined, as is true of all states. States, however, differ substantially in the amount of revenue collected, investments made, and services provided at the state versus the local levels. For example, Hawaii has a single statewide school district while K-12 education is a local function in every other state, albeit with varying levels of state support. Because of the interconnectedness of state and local budgets, we start this section by comparing New Hampshire to other states in combined level of state and local spending and revenue, and then examine the state and local levels individually.
As more fully explained in the box below, in this section, we measure government spending and revenues as a share of the states’ economies and we also show spending per capita. Spending and revenue relative to the size of the economy are good indicators of a state's choices in providing public services and investments relative to its resources and capacity to provide them. The per capita measure tells us the amount of spending per resident in the state which can provide insight into the relative level of service offered.
When comparing spending and revenue between states, simply looking at total dollar amounts rarely provides useful insights. The fact that the state and local governments of Texas spent $290.6 billion in 2019 and New Hampshire governments spent only $13.3 billion that year doesn’t tell us that Texas spends extravagantly while New Hampshire is frugal. Texas has a $1.8 trillion economy and nearly 29 million people, while New Hampshire has a $88 billion economy and 1.36 million people [4]. For that reason we scale the spending and revenue numbers we use to compare states in two ways: as a share of state gross domestic product (GDP) and per capita.
4. As of 2019, the most recent year for which the Census Bureau’s State and Local Government Finances data are available.
State GDP is a measure of the size of the economy (see the What is New Hampshire? Economy section for a fuller description). Spending and revenue as a share of a state’s economy tell us how much a state is choosing to spend and collect relative to what is available to spend and collect. Poor states inevitably spend less in dollars per resident than rich states on many public services because they lack resources, not necessarily because they have decided that lower spending is best for their community. Thus, scaling spending by the size of a state’s economy is a better indicator of the policy choices the state is making.
Similarly, when comparing revenues to assess the level of taxes and fees, share of the economy is the superior metric. Measuring simply by the dollar amount—either per capita or in total—distorts the analysis because two states, one more affluent than the other, with the exact same revenue/tax system, would look very different by that measure even though identical people or businesses in each state would face identical levels of taxation. The wealthier state would have higher revenue simply because it has more people and businesses engaging in higher dollar-value, tax generating, economic activity—not because the taxes are different between similar taxpayers in the two states. Measuring revenues as a share of the economy effectively measures the overall level of taxes and fees on people and businesses in the state regardless of the details of the revenue system and is adjusted for economic differences.
The people of states with higher spending and revenue as a share of GDP are choosing to collect and allocate a higher share of the resources available in the state to public purchases and investments—in education, parks, infrastructure, etc. States with lower spending and revenue as a share of GDP are making the opposite choice. Comparing specific spending categories or revenue sources as a share of GDP gives us an indication of the relative benefits and burdens of those particular spending categories and revenue sources among states.
Comparing state spending-per-person is a useful complement to the share-of-GDP measure for comparing government spending levels because it gives us a sense of the relative level of service or investment being provided. A rich state might spend a smaller share of its economy on parks and recreation than a poorer state, but with its greater GDP per person it may spend more per person and offer superior parks and recreation. Thus, comparing state expenditures by both share of GDP and per capita allows for nuanced and meaningful comparisons.
State and Local Spending in 2019
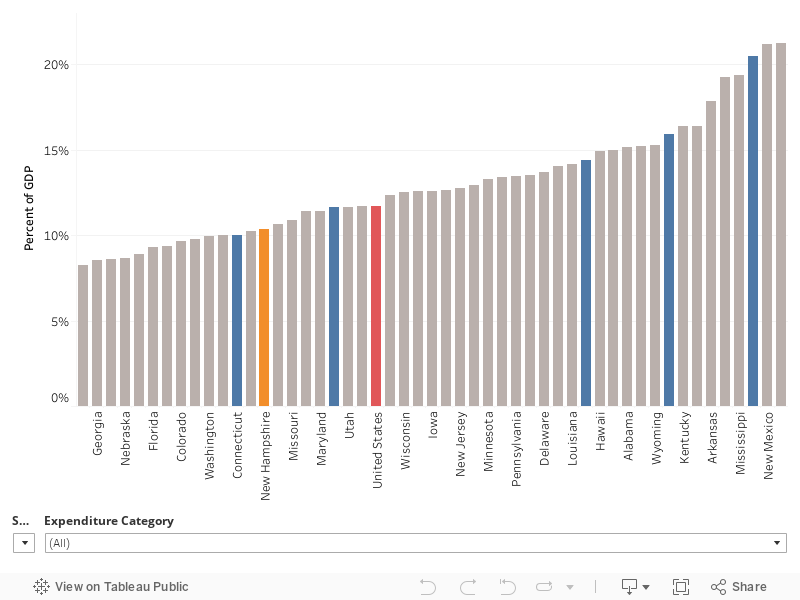
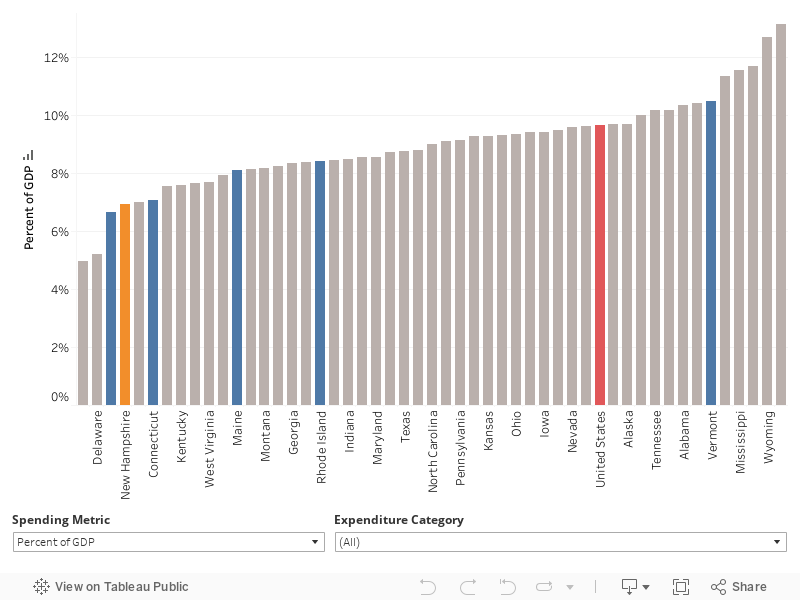
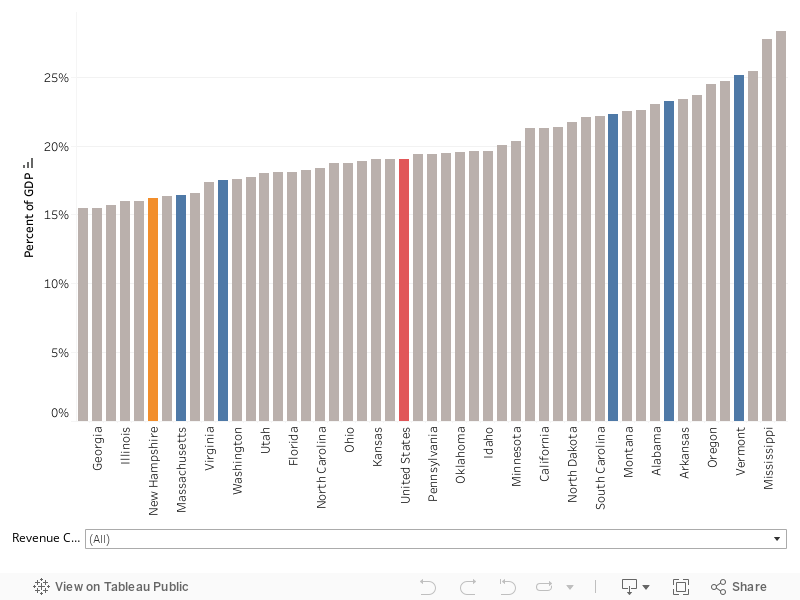
In total, New Hampshire state and local governments spent $13.3 billion in 2019—the latest year for which Census Government Finances data are available [5]. This amounted to 15.2 percent of the state’s economy, placing New Hampshire forty-seventh of the fifty states in spending as a share of GDP. As a relatively wealthy state, New Hampshire nevertheless ranked thirty-eighth in per capita spending. Chart 1 shows New Hampshire’s expenditures relative to other states and the country as a whole by either percent of GDP or per capita, with comparisons available for different spending categories through a drop-down menu. In 2019, New Hampshire ranked below the national median in all types of spending as a share of the state’s economy except liquor store expenditures and the small categories of governmental administration, and “other” general expenditures.
5. Note that combined state and local spending measures net out intergovernmental transfers to keep spending from being double counted, whereas state and local spending individually reflects spending done at those levels including intergovernmental transfers from the state or local level.
Chart 1. Combined State and Local Expenditures by Category as a Share of State Economy and Per Capita, 2019
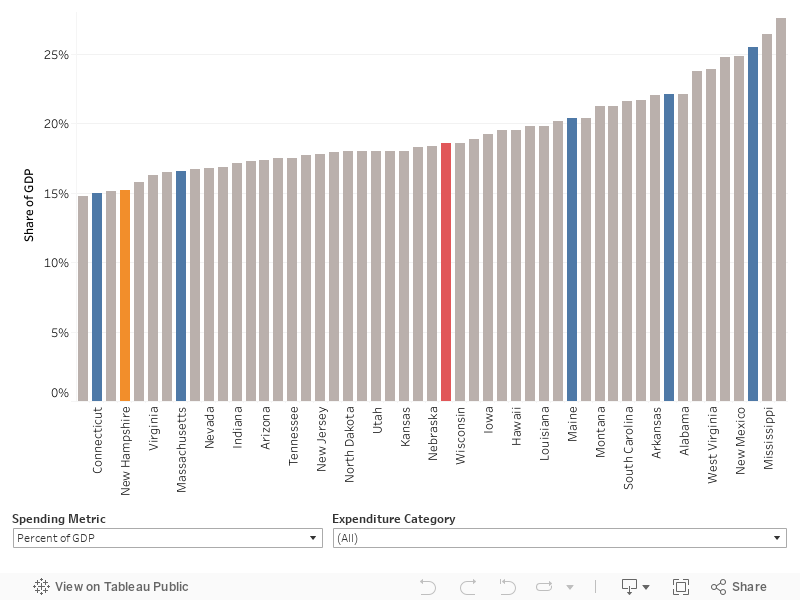
Source: U.S. Census Bureau, 2019 Annual Surveys of State and Local Government Finances; Bureau of Economic Analysis. Calculations are the work of the authors.
Overall, New Hampshire spends less as a share of its economy than its fellow New England states other than Connecticut, in large part due to lower spending on social services/income maintenance and public transportation combined with just average education spending.
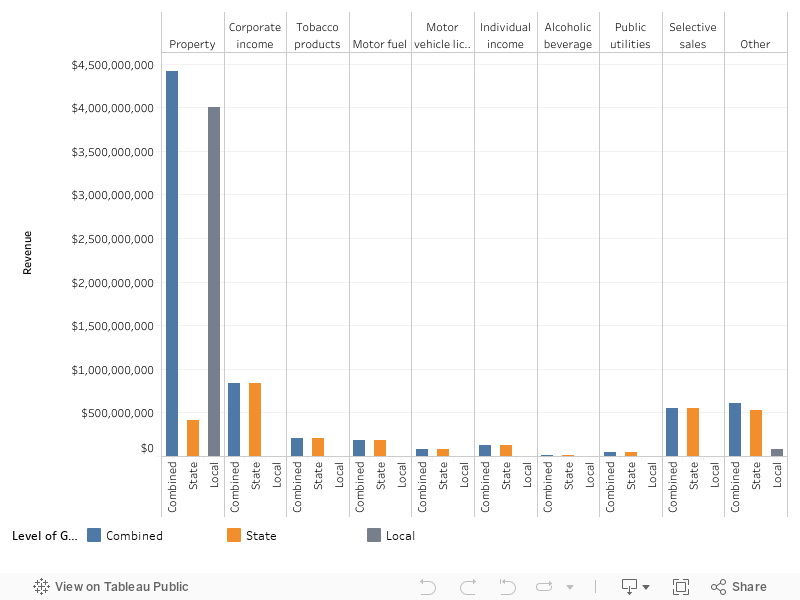
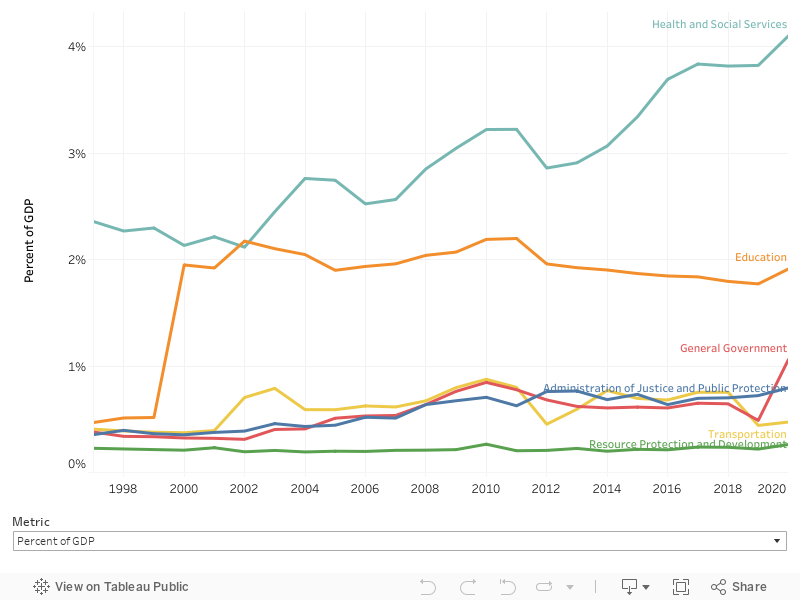
Chart 2 shows how much New Hampshire state and local governments combined spend in each category, while Chart 3 shows separately the levels of spending at the combined, state, and local levels. The largest two categories for New Hampshire’s overall state and local spending are education and social services/income maintenance (which includes health spending), which accounted for a combined 53.6 percent of total spending in New Hampshire in 2019.
Chart 2. New Hampshire State and Local Expenditures By Category, 2019
Source: U.S. Census Bureau, 2019 Annual Surveys of State and Local Government Finances. Calculations are the work of the authors.
Chart 3. New Hampshire Expenditures by Category and Level of Government, 2019
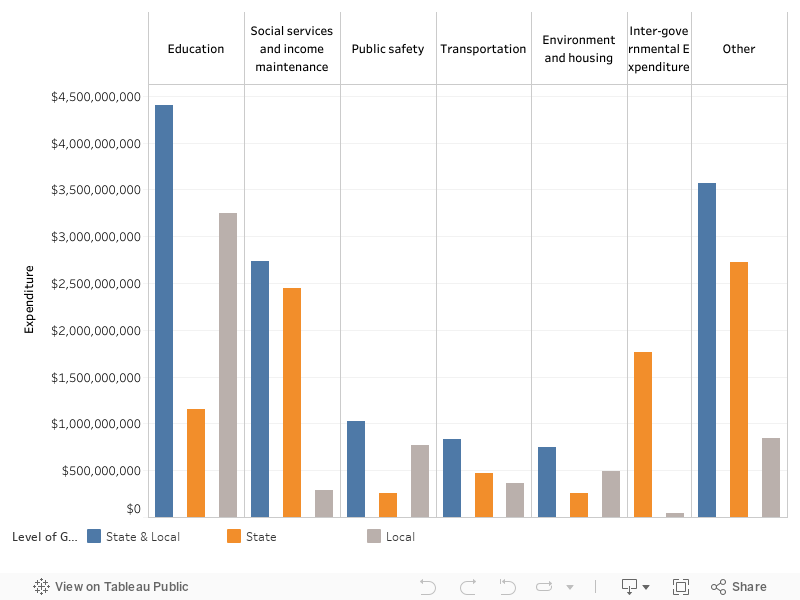
Source: U.S. Census Bureau, 2019 Annual Surveys of State and Local Government Finances. Calculations are the work of the authors.