Senior Tax Breaks on the Move—but Are Seniors Actually Moving?
download the brief
Key Findings


Every state in the United States with an income tax offers some kind of tax break to its older citizens. These breaks are often sizable, resulting in an elderly household owing substantially less in income taxes than a non-elderly household with the same income. In Alabama, Georgia, Hawaii, Illinois, Michigan, Mississippi, and Pennsylvania, married elderly households can have incomes well over $100,000 and not owe any state income taxes at all. Such tax breaks come at considerable cost to state coffers, a cost that is almost certain to grow as the elderly population grows in both size and economic status. Yet there is little evidence that these tax breaks are providing states with any economic benefit, and the savings are skewed toward those in little need of public support.
These tax breaks appear to be expanding. Since the beginning of 2017, legislators in at least thirteen states have proposed or established significant expansions:
Laws eliminating all taxes on Social Security income have been proposed in Vermont, Montana, and Minnesota, with projected annual budget costs of $30 million, $75 million, and approximately $425 million, respectively. Laws that would go further and exempt all pension income have been proposed in Connecticut and Nebraska.
In January, Arkansas began exempting all military pension income from taxation, and similar laws are being considered in at least six other states.
After much debate last year, New Jersey enacted legislation doubling the $20,000 exemption on retirement income in 2017 and increasing it to $100,000 by 2020.
These examples demonstrate the substantial size of these tax breaks and their potential cost to state governments in terms of foregone revenues. The justifications typically given for these policies are that elderly households are stretched financially and are in need of these breaks, and that reducing the elderly’s income taxes will make the state a more attractive retirement destination, which is presumably good for the economy. Among the recent arguments:
Too many people in New Jersey face retirement with insecure incomes and too many retirees find it hard to make ends meet on their income.
—NJ Senator Paul Sarlo, author of the bill to increase the pension exemption1
These seniors are taking their pensions and fleeing to Florida and other states that do not tax it, and we want to keep them here where they pay taxes and contribute to our community.
—NY State Senator Hugh Farley in 2016, pushing legislation, which passed in June, that would double the pension exemption to $40,000 at an annual cost of $275 million2
We want people to stay in Connecticut and not leave for lower-tax states that don’t tax their pensions, especially our senior citizens. This is an issue of fairness.
—CT State Representative Laura Devlin, proposing legislation in January 2017 exempting all Social Security and pension income from income taxes3
After describing how these tax breaks work, this brief explores whether there is convincing evidence to support these arguments. We examine which taxpayers benefit most from these tax breaks and whether these policies are indeed helping the most economically vulnerable households. We then turn to the costs of tax breaks in terms of foregone state revenues and whether the breaks affect elderly persons’ location decisions in such a way that the tax breaks could, as some policy makers assert, pay for themselves.
Background and Our Tax Measures
State income tax breaks for the elderly typically fall into three categories (see Box 1): (1) deductions, exemptions, and credits given on the basis of age (usually age 65 or over), (2) exemptions for Social Security benefits, and (3) exemptions for pension or other retirement income.
Deductions, exemptions, and credits tend to be modest in size and have tracked federal income tax policy; thirty-five of the forty-four states with income tax systems offer some form of age-based tax break. Likewise, Social Security benefits are tax free for low-income households in all states and under federal tax law. For higher-income households, up to 85 percent of benefits are subject to federal income tax, with the portion increasing with income. The majority of states treat Social Security benefits as tax-free for all households, and the rest follow at least the federal tax rules.
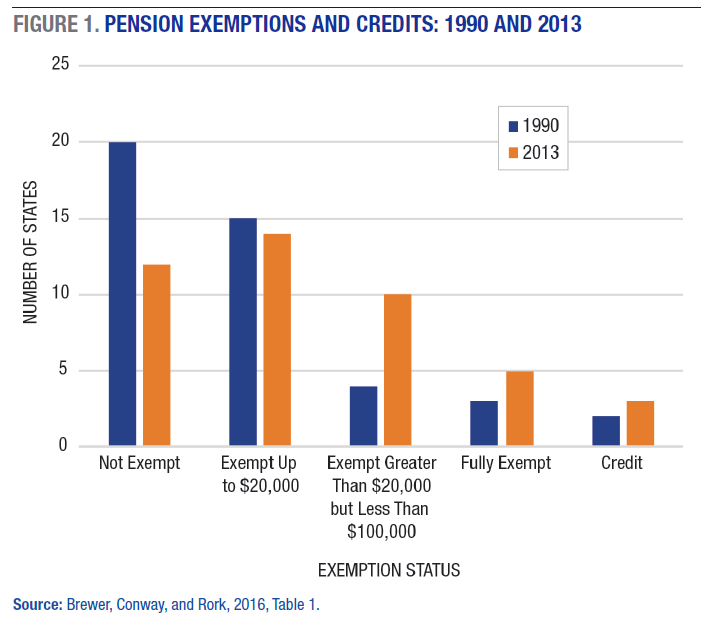
On the third type of tax break, exemptions for pension or other retirement income, states differ from the federal government, which taxes all such income, and from each other. It is also the tax break that has experienced the most growth. As shown in Figure 1, in 2013 only twelve states offered no exemption at all, while five exempted all pension income and another ten allow between $20,000 and $100,000 in pension income to be exempt from taxation. Both the number of states offering exemptions and the size of the exemptions have grown since 1990.
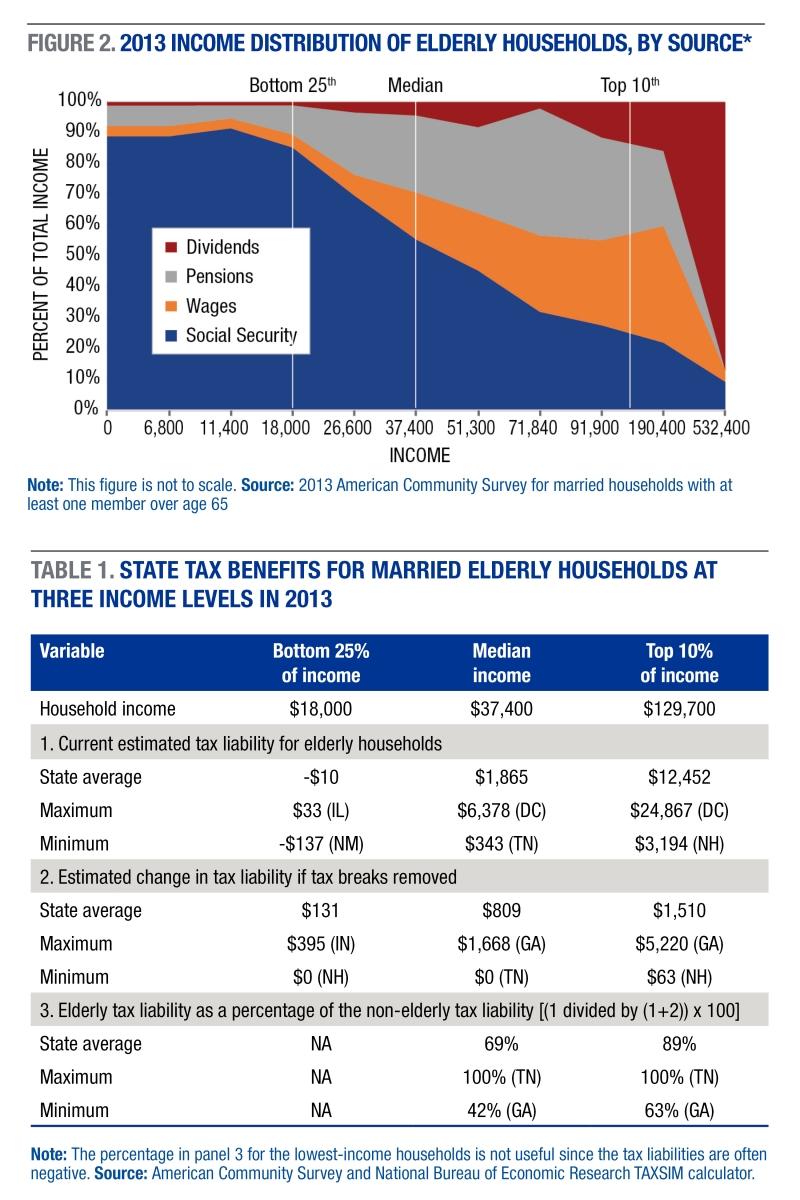
All three tax breaks tend to benefit middle- and higher-income taxpayers the most. Low-income households owe little tax, even without these breaks, and these exemptions are not refundable (that is, tax liabilities do not go below zero). Because Social Security benefits are based on earned income, they tend to be larger for higher-income households, and so a larger amount is exempt. However, higher-income households tend to receive a smaller proportion of their income from Social Security than do middle- or lower-income households, as shown in Figure 2. Finally, the tax savings from all three types are greater the larger one’s marginal tax rate, and since most states have graduated income tax systems, the tax savings from these policies increase with income.
The full effect of these tax breaks is more complicated than the level of the exemptions and the marginal tax rate because the policies are often linked and the definitions of retirement income vary. Some states include Social Security benefits or even some earned income in their definition of the retirement income that can be exempt, while others phase out the exemptions for high-income households or exempt only defined-benefit pension income.
We therefore create a summary measure of the tax benefits of being an elderly household for a variety of income levels and in every state, using household income data from the American Community Survey (ACS) and the National Bureau of Economic Research (NBER) TAXSIM calculator (see Box 2).4 We also use the ACS and decennial census data to provide information on the distribution and composition of income for elderly and non-elderly households.
Distributional and Revenue Effects
The financial need argument for these tax breaks presumes that the elderly are a relatively needy group and that the tax breaks target the most economically vulnerable among them. Our research casts doubt on both notions.
Historically, the elderly have had lower median incomes than the non-elderly, but this pattern has changed dramatically in the last 20 years.5 While the average married, elderly household had total income equal to 64 percent of that of non-elderly households in 1990, by 2013 that percentage had grown to 101 percent (that is, elderly households had slightly higher incomes). The data also show that the elderly have experienced a much smaller increase in income inequality than the non-elderly during this period.
Some elderly households no doubt still experience substantial financial difficulties, especially those headed by single females (often widows). Do these tax breaks help those households? The answer is no, for several reasons. Most of these households’ income comes from Social Security benefits, which at these low income levels would not be subject to even federal income tax. Even if benefits were taxable, in most states these households would face little or no income tax because of their very low incomes, regardless of their age. In fact, to the extent that they receive income from wages, some of these very low income households are actually harmed by their age because after age 65 they are no longer eligible for the often refundable Earned Income Tax Credit. To sum up, neither federal nor state income tax breaks targeting the elderly offer much help to the lowest-income households because these households would owe little or no income tax without them. To help these groups would require enacting refundable tax breaks or credits.
Our estimated tax benefit measures, summarized in Table 1 and Figure 3, underscore these conclusions. Elderly households in the bottom 25 percent of the income distribution pay very little state income taxes, with an average of negative $10 under current tax policy. Removing all state tax breaks, which includes the extreme policy change of making all Social Security benefits taxable, leads to a $131 average increase per year. Note that going in the other direction—that is, expanding existing tax breaks—would have little if any effect on their tax liability because such breaks are not refundable.
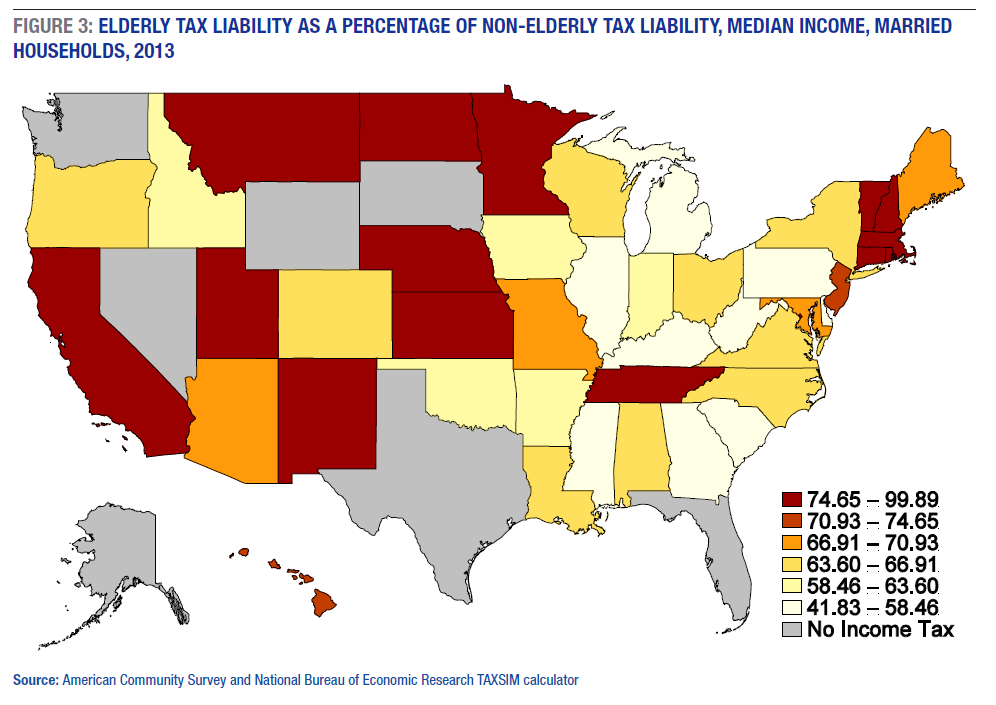
It is the middle- and high-income elderly who benefit most from current tax policy, and proposals to expand these tax breaks primarily benefit the highest-income taxpayers since the proposals would exempt even larger amounts of income. Elderly households at the median pay $809 less on average than if they were non-elderly, which results in them paying about 69 percent of what non-elderly households of the same income level pay. This tax benefit varies widely across the states, from zero in Tennessee (a state without a broad-based income tax) to $1,668 in Georgia. Figure 3 shows a geographic pattern to these breaks, in which the southeastern and central Midwestern states offer the biggest tax benefits and the Plains, California, and upper Atlantic seaboard offer the least.
While the top 10 percent pay almost 90 percent of what a non-elderly household of the same income level pays, they still receive a sizable benefit on average ($1,510), and recent and currently proposed expansions would benefit them the most. For example, in past work we estimate that a 2010 law in Georgia that would have increased the retirement exemption from $65,000 to $100,000 in 2013 would have had no benefit for the bottom 75 percent of the income distribution.6 And because the tax liabilities are large in dollar terms, this change would have cost Georgia $100 million in tax revenues.
More generally, we estimate that the revenue costs of these tax breaks are often substantial. On average, the income tax revenues raised from elderly households would be 50 percent higher if all tax breaks were removed, equivalent to about 7 percent of all state income tax revenues. This percentage will almost surely increase as the population ages, which census data show has not yet occurred but soon will. (The elderly make up 18.4 percent of the adult population in each state on average, according to ACS data, a percentage that has barely increased since 1990; however, the Census Bureau projects the proportion of the elderly in the population to increase by nearly 50 percent between 2010 and 2030).7 Our calculations therefore underestimate the likely revenue impact of these policies in the years to come. In addition, these average impacts mask large variation across the states. Some states, such as Delaware (11.5 percent), Georgia (12 percent), Kentucky (11 percent), Michigan (14 percent), Mississippi (12.6 percent), Pennsylvania (11.7 percent), and South Carolina (14.6 percent), lose far more than 7 percent of their income tax revenues to these tax breaks (see Box 3). These states are the ones that grant the largest pension exemptions and so serve as a benchmark for those states currently considering the large expansions mentioned above (including Connecticut, Minnesota, Montana, Nebraska, New Jersey, New York, and Vermont).
Our research therefore suggests that current tax breaks primarily benefit the middle- and upper-income elderly and that further expansions, as currently proposed, would benefit primarily the highest-income households. These tax breaks also come at a significant cost to the state in terms of revenues. Policy advocates often argue that such tax breaks will “pay for themselves” by encouraging the elderly to remain in the state and by enticing more elderly to locate in the state—an assertion that brings us to the next section.
Do These Policies Affect Migration?
Elderly persons do not move between states that often: less than 1 percent of the population age 65 and over moves across state lines in any given year. Moreover, that number has been fairly steady over the last few decades and has been declining, if anything.8 Such a low rate of migration casts doubt on assertions such as those quoted above that the elderly are fleeing or flocking to states because of taxes.
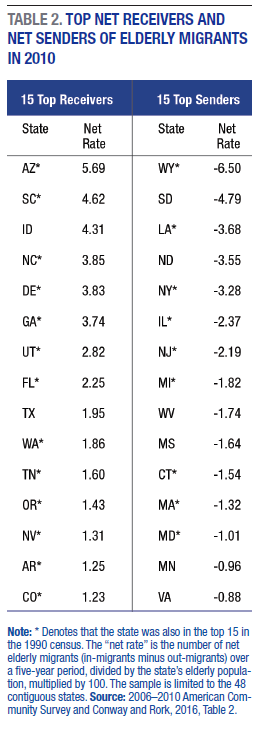
This low overall rate masks important variations across states, however, and policies could still be influencing the decisions of the small percent who do move. Table 2 shows the top fifteen net receivers of elderly migrants and the top fifteen net senders (or “winners” versus “losers”). Not surprisingly, the top receivers tend to be Southern states with temperate climates, a low cost of living, and many natural amenities. These states also tend to have lower income tax burdens and large tax breaks for seniors (see Figure 3). The reverse is also true in that the top senders tend to be Northern states with higher costs of living and heavier tax burdens. Given these broad differences between receiving and sending states, just how much of these migration patterns can we attribute to tax policy? Is it Florida’s weather or its lack of an income tax that makes it a draw for retirees?
Studying the relationship between changes in tax policy and changes in migration patterns allows researchers to better isolate the effects of tax policy from other state amenities such as climate, cost of living, and quality of life. We conducted a formal investigation into this relationship in a recent work.9 Using four decades of decennial census data, we estimated regression models of elderly migration that control for other factors that could affect migration, such as weather and natural amenities, cost of living, unemployment rates, and other state policies and programs of interest to the elderly (like estate taxes and spending on hospitals).10 We estimated several variants of this model, measuring the tax breaks in different ways to ensure that our results were not sensitive to one specification or variable. The models were also estimated for the high-income (top 25 percent) and low-income (bottom 25 percent) elderly separately, as we would expect the tax policies to have the stronger effect on the high-income elderly. Across all of these analyses, we failed to find any statistically significant effect of these income tax breaks on elderly migration.
A limitation of this work is that it ends in 2000. In the 2000s, the decennial census long form—the largest source of migration data—was replaced with the annual American Community Survey. The ACS is a smaller dataset with a different survey process and different definitions of both residence and migration than the census long form, and the change in the form used makes extending our earlier analyses into the 2000s difficult.11 To ascertain whether our earlier findings of no meaningful effect extend to the 2000s, we perform two exercises.
First, we return to Table 2 and compare the migration patterns in 1990 versus 2010. Income tax breaks for the elderly have changed a lot during this time, while elderly migration patterns have been quite stable. For instance, thirteen of the top fifteen receivers in Table 2 were also top receivers in 1990; similarly, nine of the top fifteen senders in Table 2 were also top senders in 1990. The fact that such tax policies have changed a great deal while elderly migration has not is a simple yet convincing piece of evidence that senior tax breaks are not a driving factor in location decisions.
Second, we make some back-of-the-envelope calculations of the costs of using these tax breaks to recruit the elderly under a best-case scenario. We begin with the extremely optimistic assumption that all elderly migrants are moving because of income tax breaks and then calculate what each of those migrants “cost,” on average, in terms of foregone tax revenues. In 2012, 43.1 million people were over age 65. Applying a high rate of migration (1 percent) by historical standards to this number yields an estimated 431,000 migrants. We estimate that existing tax breaks cost the states $30.1 billion in 2012, or $69,837 per migrant. This exercise suggests that existing tax breaks cost the states nearly $70,000 per elderly migrant whom they could potentially recruit. To put this number in context, note that the median income of an elderly person was less than $25,000 in 2012. These migrants would therefore have to generate economic benefits almost three times the size of their annual incomes for these tax breaks to “pay for themselves.” This high cost per potential migrant is not surprising given the low level of migration combined with the sizable revenue costs of these tax breaks. And if migrants are not much affected by tax breaks, as empirical evidence suggests, the cost of each migrant actually recruited by tax policy is far higher and therefore even less likely to be offset by any economic benefits generated. In sum, we conclude that it is highly unlikely that these tax breaks pay for themselves.
Conclusion
Policies that reduce the state income taxes owed by elderly households are widespread and come in many forms. Such tax breaks result in elderly households paying substantially less in income taxes than non-elderly households with the same income, and the tax breaks come at a significant cost in terms of foregone revenues. And yet many states are currently considering expanding these breaks. The primary reasons given by proponents of such expansions are that the elderly are an especially needy group of taxpayers and that such tax breaks will prevent the elderly from fleeing to other states with lower taxes.
This brief provides evidence refuting both of these arguments. As a group, the elderly now have similar incomes and actually experience less income inequality than non-elderly households. Moreover, expanding these tax breaks will do little to help the most economically vulnerable among the elderly because such households already pay almost nothing in income taxes under current policy. Increasing the amount of pension or Social Security benefits that are exempt would instead help only those elderly much higher up in the income distribution. Our analyses further suggest that if state policy makers really want to help the poorest elderly households, they could consider extending the refundable Earned Income Tax Credit to those over age 65 or enacting some other kind of refundable low-income tax credit such that the household could actually receive a payment from the government.
The idea that such tax breaks pay for themselves by attracting retirees into the state or discouraging existing residents from leaving also finds little support. Census data show that elderly migration is a fairly rare event, with a pattern of movement that has remained stable for decades, despite many new tax breaks designed to attract the elderly. Our formal analyses likewise provide no consistent evidence that these tax breaks influence migration decisions in a meaningful way. Even if we cast this evidence aside and instead use extremely optimistic assumptions about the impact on migration, these tax breaks seem highly unlikely to pay for themselves.
If such tax breaks are expanded, our analyses suggest that higher-income households will be the primary beneficiaries and that the change will do little to stem the flow of retirees leaving the state. Moreover, those foregone tax revenues must somehow be paid for, presumably through cuts to spending—spending that could help the needy elderly or improve economic growth—or through increases in other taxes and fees.
Box 1: Three Tax Breaks for Seniors and How They Work
1. Deductions, exemptions, and credits given on the basis of age (usually 65 and over)
Exemptions and deductions are subtracted from taxable income, which reduces the tax liability by the amount of the exemption or deduction times the individual’s tax rate.
Credits are subtracted from the tax liability, and reduce the tax liability dollar for dollar. If the credit is refundable, the tax liability can be negative, such that the household receives a payment from the government. Age credits are generally not refundable.
Example: The Johnsons have a taxable income of $50,000, on which they pay 10 percent in taxes, or $5,000.
If they can claim an age exemption or deduction of $2,000, their taxable income is now $48,000, and they will pay $4,800 in taxes. The exemption/deduction saved them $5,000-4,800 = $200, or the amount of the exemption ($2,000) times the tax rate (0.10) they would have paid on that $2,000. Key implications are:
-
If the Johnsons had faced a higher marginal tax rate, the exemption would have saved them even more in taxes; for example, if their tax rate was 0.25, they would save $500 in taxes.
-
In most tax systems, the marginal tax rate increases with taxable income; therefore, the tax savings from deductions and exemptions tend to be largest for the highest-income households.
-
If the Johnsons’ taxable income or tax liability was zero initially, the exemption/deduction would be of no benefit to them.
-
Turning to credits, if they can claim an age credit equal to $2,000, they will pay $5,000-2,000 = $3,000 in taxes. The credit saved them $2,000.
-
If they can claim an age credit equal to $6,000, they will owe $5,000-6,000 = minus $1,000 in taxes. If the credit is refundable they will receive a $1,000 payment from the government.If it is nonrefundable, they will simply owe no taxes.
2. Exemption of Social Security benefits
For federal taxes, benefits are excluded for single/married households with provisional income below $25,000/32,000. Households with incomes above those thresholds must include a portion of their benefits in their federally taxable income; the portion increases as income rises, up to a maximum of 85 percent. Even for the highest-income households, 15 percent of benefits are exempt from income taxation.
States treat Social Security benefits in three ways: (1) they don’t tax them at all, (2) they follow the federal law, or (3) they include some benefits in taxable income for high-income households but at a lower rate than federal law.
3. Exemption of pension or retirement income
Many states exclude a certain amount of pension income from taxable income. These policies differ across states in:the amount of income that can be excluded (see Figure 1)
the definition of pension income, ranging from very broad (including Social Security, wages, dividends, and interest) to narrow (only defined benefit pensions)
the availability to high-income households, as exemptions are sometimes phased out with income
Just as with the age-based exemptions, the tax savings from exempting Social Security benefits and pension income is larger for high-income households than for other households because high-income households typically face a higher marginal tax rate and they owe enough taxes to be able take advantage of the reduction. Only a nonrefundable tax credit provides the same tax savings to all households.
Availability of senior exemptions, deductions, and credits
Of the 44 states with income tax systems:
-
35 offer an extra exemption, deduction, or credit based on age.
-
29 exempt all Social Security benefits from taxation.
-
5 states fully exempt pension/retirement income from taxation.
-
27 states exempt some pension/retirement income from taxation or offer tax credits for pension income.
Box 2. Measuring the Benefits for Taxpayers Age 65-Plus
Our calculated tax benefit measures the difference in the estimated state income tax liability a household would face if it was elderly or not. It is constructed for households at three points in the income distribution—bottom 25 percent, median, and top 10 percent. The measures are constructed according to the following steps:
-
2013 ACS data are used to identify the level and sources of income for elderly households at the three income levels.
-
NBER’s TAXSIM calculator is used to estimate the state income tax liability these households would face in every state with an income tax, given the level and sources of income.
-
This step creates the current tax liability for the three elderly household types for every state.
-
To simulate the tax liability for these households if they were not elderly, TAXSIM recalculates the tax liability removing any age-based exemptions, deductions, or credits and switching all sources of retirement income into other income (which has no special exemptions).
-
This step creates the tax liability for the three elderly household types for every state if they were not elderly.
-
Subtracting #2 from #3 yields the amount by which the estimated tax liability is lower because the household is over age 65 and receives income from retirement income sources.
Box 3: Revenue Foregone From Tax Breaks for the Elderly
50% = the average amount that income tax revenues from elderly households would increase if all current tax breaks were removed.
7% = the amount of total state income tax revenues forgone due to current state tax breaks for the elderly. This amount is far higher in some states:
-
Delaware–11.5%
-
Georgia–12%
-
Kentucky–11%
-
Michigan–14%
-
Mississippi–12.6%
-
Pennsylvania–11.7%
-
South Carolina–14.6%
Endnotes
1. See https://tcms.njsba.com/PersonifyEbusiness/Default.aspx?TabID=5271.
2. Marie J. French, “Senate GOP: Keep Seniors in New York by Exempting More Private Retirement Income From Taxes,” Albany Business Journal, March 9, 2016, http://www.bizjournals.com/albany/news/2016/03/09/senate-gop-keep-senior....
3. Donald Eng, “Devlin: ‘Retire’ Tax on Pensions, Social Security,” TrumbellTimes.com, January 30, 2017, http://www.trumbulltimes.com/63941/devlin-retire-tax-on-pensions-social-....
4. Karen Smith Conway and Jonathan Rork, “The Consequences of State Tax Preferential Treatment of the Elderly,” in Taxation and Migration, edited by R. Avi-Yonah and J. Slemrod (Wolters Kluwer, 2015): 151–86; Ben Brewer, Karen Smith Conway, and Jonathan Rork, “Protecting the Vulnerable or Ripe for Reform? State Income Tax Breaks for the Elderly-Then and Now,” Public Finance Review (published online September 9, 2016).
5. Brewer, Conway, and Rork, 2016.
6. Conway and Rork, 2015, Table 6.9.
7. Loraine West et al., “65+ in the United States: 2010,” Table 1-1, U.S. Department of Commerce, Economics and Statistics Administration, U.S. Census Bureau (2014), accessed September 28, 2015, http://www.flhsa.org/uploads/pages/pdf/2010%20Census%20Report_%2065-lowe....
8. Karen Smith Conway and Jonathan Rork, “How Has Elderly Migration Changed in the 21st Century? What the Data Can – and Cannot – Tell Us,” Demography, 53(4) (August 2016): 1011–25.
9. Karen Smith Conway and Jonathan Rork, “No Country for Old Men (and Women) – Do State Tax Policies Drive Away the Elderly?” National Tax Journal, 65(2) (June 2012): 313–56.
10 Specifically, we estimate the standard gravity model of migration, in which the natural log of the migration flow is regressed on the natural log of the population in the origin and destination states, other characteristics of the origin and destination states, and the distance between the two. The model is estimated with multiple regression using migration data from the 1970, 1980, 1990, and 2000 decennial censuses. By including year and origin-destination pair fixed effects, the analyses focus on the changes in migration and the changes in state characteristics and policies over time.
11. Conway and Rork, 2016.
Acknowledgements
The author thanks Ben Brewer and Jonathan Rork, who are coauthors of the research summarized here and have been an enormous help in developing this brief. The author also thanks Michele Dillon, Michael Ettlinger, Curt Grimm, and Amy Sterndale of the Carsey School of Public Policy for comments and suggestions; Patrick Watson for editorial assistance; and Laurel Lloyd and Bianca Nicolosi at the Carsey School for layout assistance.