U.S. Population Growth Slows, but Diversity Grows
Key Findings
The U.S. population continues to become diverse even as population growth slows.
Recent U.S. population gains were due to minority population increases.
Nearly 70 percent of the minority population gain was due to births exceeding deaths.
Children are in the vanguard of the growing diversity of the U.S. population.
Last year, the U.S. population grew at the lowest rate in a century because there were fewer births, more deaths, and less immigration. Fertility rates diminished regardless of race or Hispanic origin and immigration declines were also widespread. As a result, the growth rate of both the minority and non-Hispanic White population diminished. Yet, the racial diversity of the population continued to grow, according to new Census Bureau estimates. This increasing diversity reflects two important demographic trends. The minority population is growing, and the non-Hispanic White population is declining. This interplay of White and minority demographic change increased diversity.
In many areas of the country, diversity is widespread. But, diversity is geographically uneven. In much of the South and West, as well as in large urban areas nationwide, the population is quite diverse. This is reflected in the yellow and orange areas of Figure 1. Here the likelihood that two residents of the same county will be of a different race or Hispanic origin is high. In contrast, in much of New England, the Great Lakes and the Northern Great Plains, the population is far more homogeneous, as reflected in the blues and greens on the map.
All of the nation’s population increase, both last year and since 2010, is the result of minority population gains. The minority population grew by 1,777,000 or 1.4 percent in the last year and by 19,500,000 or 17.5 percent since 2010. A Hispanic population gain of 932,000 fueled 60 percent of the entire population increase last year. Non-Hispanic Asians and Blacks also made significant contributions to recent growth at 360,000 and 287,000, respectively. Both the multi-race (173,000) and Native peoples (24,400) populations grew as well. In contrast, the non-Hispanic White population diminished by 225,000 between July of 2018 and July of 2019.
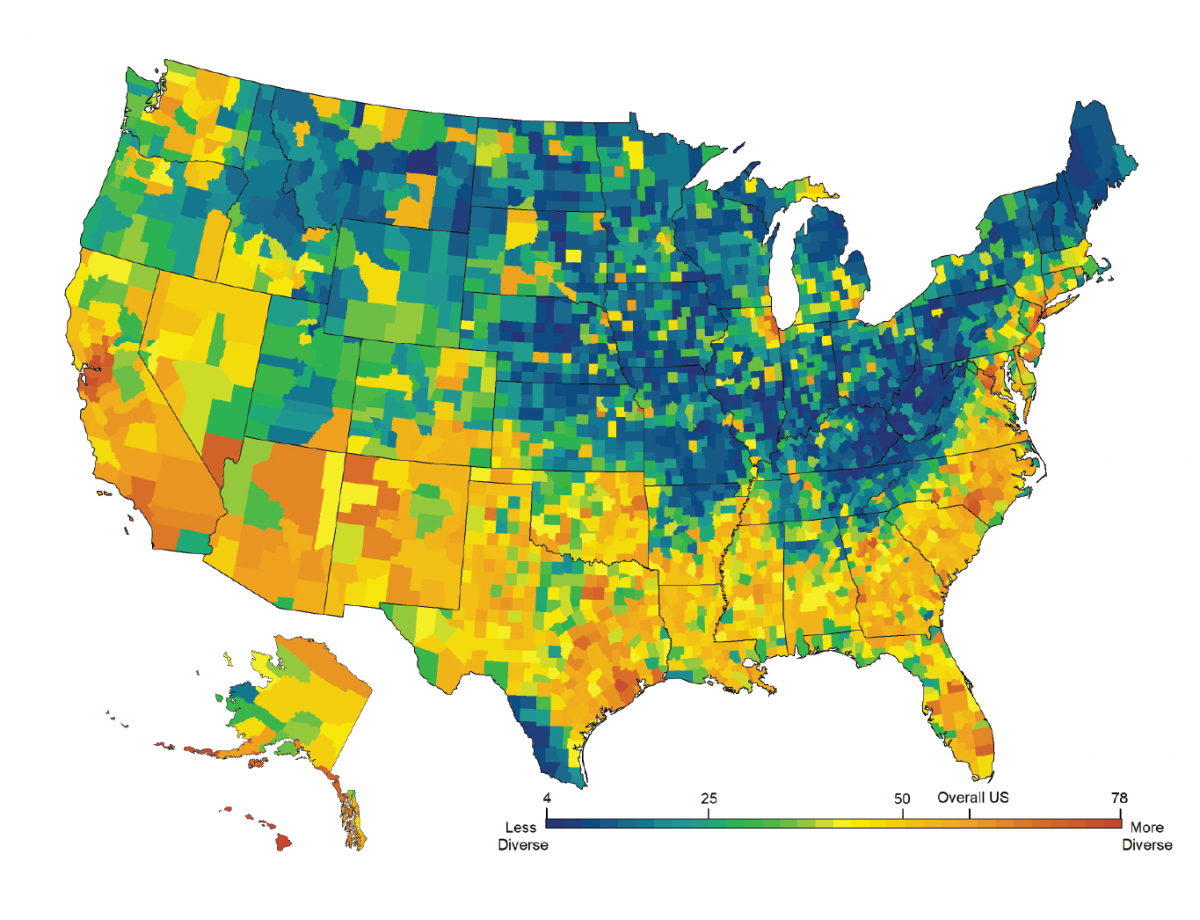
Source: U.S. Census Bureau, Population Estimates, 2019. Analysis: K.M. Johnson, Carsey School, UNH
The latest Census Bureau estimates are that the population was: 60.1 percent non-Hispanic White; 18.5 percent Hispanic; 12.5 percent non-Hispanic Black; 5.8 percent non-Hispanic Asian; 2.2 percent non-Hispanic of two or more races; and .9 percent Native Peoples (Figure 2).

Kenneth M. Johnson is Senior Demographer at the Carsey School, Professor of Sociology at the University of New Hampshire, and an Andrew Carnegie Fellow.
The distinctly different demographic trajectories among non-Hispanic Whites and minorities result from the interaction of several key demographic forces. Natural increase (births minus deaths) produced 62 percent of the modest U.S. population gain last year. Immigration remained important as well, producing the other 38 percent of last year’s population gain. Though both natural increase and immigration have diminished over the past several years, they continue to contribute to the growing diversity of the U.S. population. The minority population is growing both because births far exceed deaths and because of modest immigration gains. In contrast, the non-Hispanic White population has diminished slightly because of reduced births, increased deaths, and minimal immigration.
The driving force behind the growth of the minority population is natural increase. Currently, there are 2.9 minority births for every death. Among Hispanics, the ratio is even higher at 4.8 births per death. Minority births exceed deaths because the minority population (with the exception of Asians) is on average nearly ten years younger than the non-Hispanic White population (median age 43.7) and because minority fertility rates are slightly higher, though they have diminished recently. Thus, minority populations include more women of child-bearing age and fewer older adults at high risk of mortality. Between 2018 and 2019, 70 percent of the minority population increase came from natural increase. Among Hispanics, natural increase was even higher accounting for 83 percent of the population increase. Thus, though immigration remains important, it is natural increase that is now producing most of the minority population gain.
In contrast, more non-Hispanic Whites are dying than being born. For every 100 non-Hispanic White deaths last year, there were only 87 births. Between 2010 and 2019, there were just 94 births for every 100 deaths. Last year, Whites accounted for 77 percent of all U.S. deaths, but 50 percent of births. The modest immigration of non-Hispanic Whites is not sufficient to offset this natural decline resulting in a small population loss.
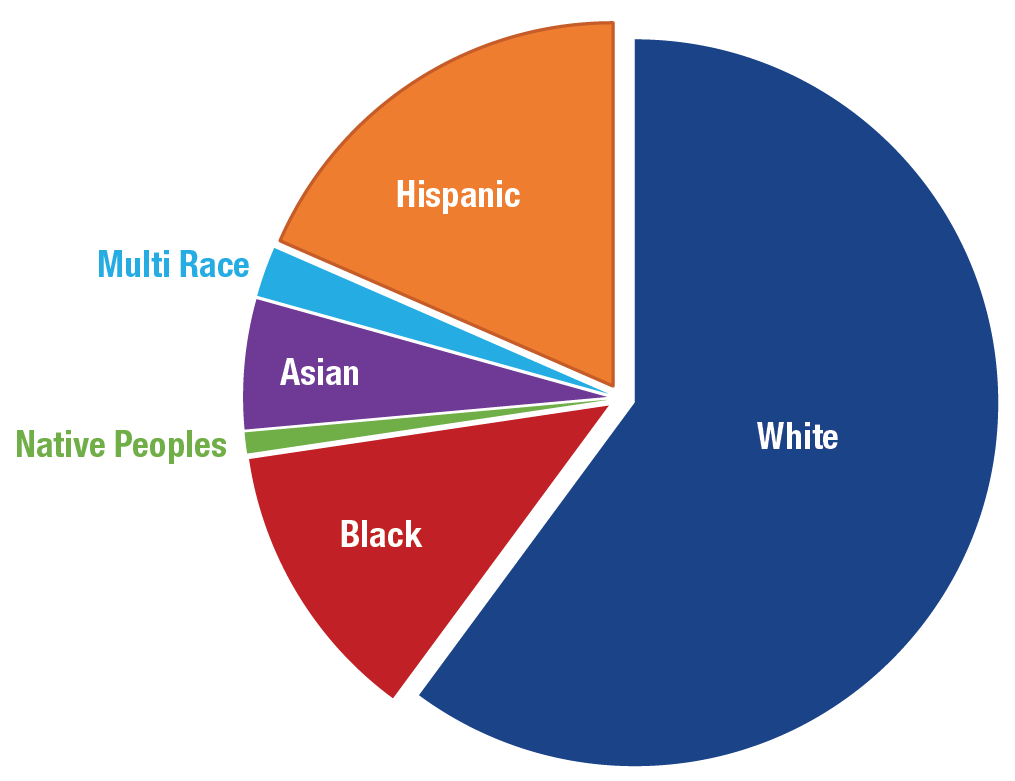
Note: The Hispanic category includes Hispanics of any races.
Source: U.S. Census Bureau, Population Estimates, 2019.
Analysis: K.M. Johnson. Carsey School, University of New Hampshire
The growth of the minority population combined with a population decline among non-Hispanic Whites increases the diversity of the population because the minorities now represent a larger share of the population than previously. However, diversity has increased at a slower rate in recent years due to fertility declines and reduced immigration among minorities. Minorities currently represent nearly 40 percent of the U.S. population compared to 36 percent in 2010 and 31 percent in 2000.
Children are in the vanguard of growing diversity. In 2019, just 50 percent of those under age 18 are non-Hispanic White. In contrast, 76 percent of the population over 65 is non-Hispanic White. Growing child diversity is fueled both by more minority children and by fewer non-Hispanic White children. Between 2010 and 2019, the minority child population grew by 6 percent, while the non-Hispanic White child population diminished by nearly 8 percent. In part, this is because there were just 1 percent more White women of prime child-bearing age (20 to 39) in 2019 than in 2010, compared to nearly 17 percent more minority women. In addition, widespread declines in fertility rates reduced both non-Hispanic White and minority childbearing. These changes have made children the leading edge of an increasingly diverse society. Though the Great Recession and its economic aftermath diminished the number of births and fertility rates among all women, the U.S. population continued to grow modestly and diversity increased. How the COVID-19 pandemic will influence future mortality, fertility, and immigration remains to be seen. While the pandemic may impact the rate of change in diversity, long-term demographic trends make it likely that U.S. diversity will continue to grow.
Data
This analysis is based on Census Bureau population estimates released on June 25, 2020. The classification of births and deaths by race in Census Bureau estimates differs from the procedures used by the National Center for Health Statistics (NCHS). Thus, there are differences in the number of births and deaths classified as non-Hispanic White by the two agencies NCHS data do not allow for multiple race births or deaths—all babies and deaths are classified to one race category. The Census Bureau allows for multiple race births and deaths. NCHS data consistently show more non-Hispanic White births than Census data do. Thus, readers should exercise caution in the interpretation of these results and recognize that this analysis is indicative of current trends using the best data available at this time.
Barbara Cook of the Carsey School provided GIS support for this project. This research was supported by the author’s Andrew Carnegie Fellowship and the New Hampshire Agricultural Experiment Station in support of Hatch Multi-State Regional Project W-4001 through joint funding of the National Institute of Food and Agriculture, USDA. The content is solely the responsibility of the author and it does not necessarily represent the official views of the sponsoring organizations.